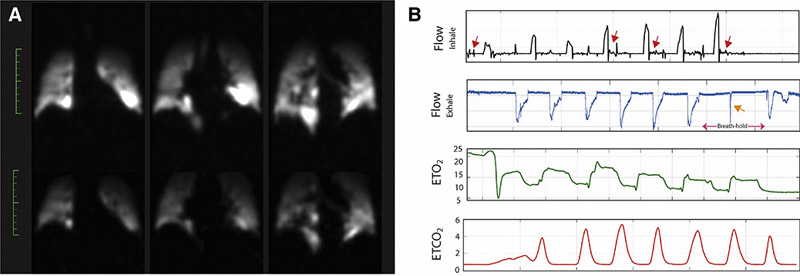
Figure 9).
A: Spin–density maps for the case of a representative subject who exhaled in the middle of the breath-hold. B: Gas delivery monitoring system plots indicating (from top to bottom) the flow of inhaled gas (black graph), flow of exhaled gas (blue graph), End-tidal O2 (green graph; EtO2) and End-tidal CO2 (red graph; EtCO2) from different representative subjects to indicate the cases in which the breathing protocol was not followed properly. The red arrows in the top plot indicate intermittent inhalation attempts during the breath-hold, while the orange arrows on the second from top graph shows the exhalation during the breath-hold.

