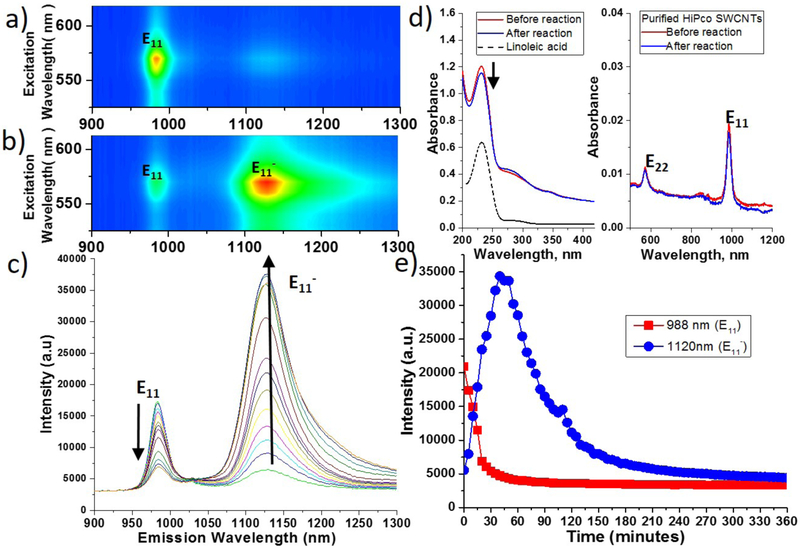
Figure 1.
EE maps of (6,5) purified HiPco SWCNTs a) before and b) after reaction with linoleic acid. Panel c) shows the spectral changes over 60 mins (spectra taken every 5 mins). d) UV-Vis absorption spectra showing the presence of lipid hydroperoxide (235 nm) and its concentration decreasing after reaction with SWCNTs. SWCNTs vis-NIR absorptions were un-shifted. e) Emission intensities of E11− and E11 of CoMoCAT SWCNTs reacted with linoleic acid over 6 hours.

