Figure 5.

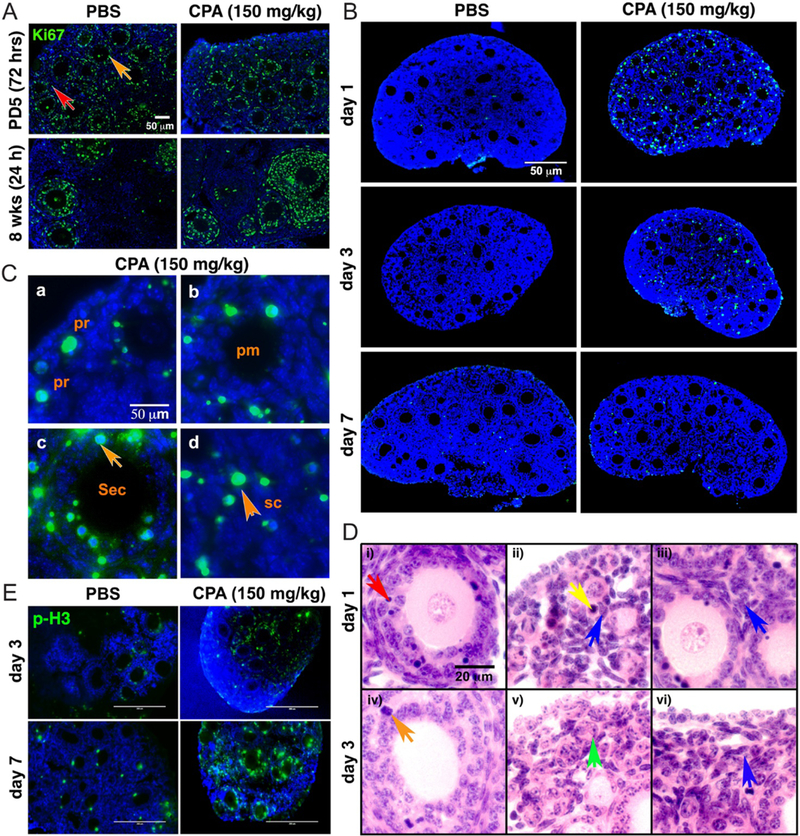
CPA induces cell death, not cell proliferation. (A) Representative images (n = 3) of Ki67 staining in PD5 (72 h) or 8-week-old mouse ovary 1 day (24 h) after injection of PBS or 150 mg/kg CPA. Granulosa (orange) and somatic cells (red) were marked with arrows. Green = Ki67, blue = DAPI. Scale bar, 50 μm. (B) Representative images of TUNEL staining of PD5 CD-1 mouse ovary 1, 3 and 7 days after injection of 150 mg/kg CPA or PBS. Green = apoptotic cells, blue = DAPI. Scale bar, 50 μm. (C) High magnification representative images of TUNEL staining 1 day after injection of 150 mg/kg CPA, showing positive TUNEL signals (green) in a primordial follicle (pr, a), primary follicle (pm, b), secondary follicle (sec, c) and somatic cell (sc, d). Blue=DAPI. Granulosa cells of secondary (sec) follicles and somatic cells (sc) are indicated with orange arrows. Scale bar, 50 μm. (D) Representative H&E images of PD5 CD-1 mouse ovary 1 and 3 days after injection of CPA. Dead granulosa cells (red arrow, i), dead primordial oocyte (yellow arrow, ii), healthy pregranulosa cells (blue arrow, ii), healthy stromal cells (blue arrow, iii), proliferating granulosa cells (orange arrow, iv), follicle-like structure without oocyte (green arrow, v) and healthy somatic cells (blue arrow, vi) are marked in each panel. Scale bar, 20 μm. (E) Representative images of p-H3 staining in PD5 mouse ovaries 3 and 7 days after injection of 150 mg/kg CPA or PBS. Green = p-H3, blue = DAPI. Scale bar, 200 μm.
