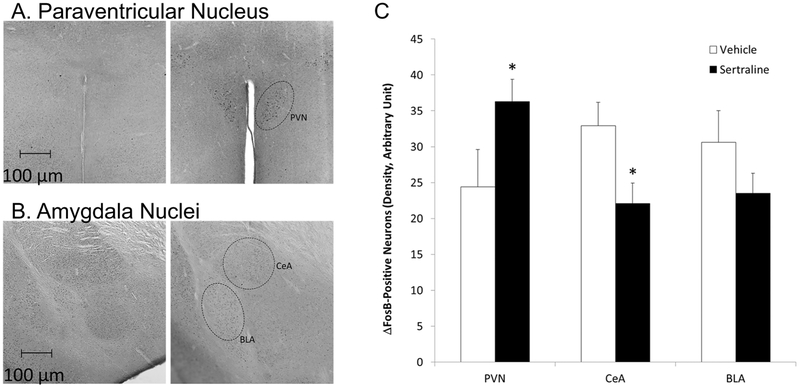
Figure 4.
Images, captured at 10x magnification, showing raw ΔFosB immunoreactivity in the PVN (Panel A) and amygdala nuclei (CeA and BLA; Panel B) in a representative male isolated prairie vole as a function of vehicle (left 2 images) or sertraline administration (16 mg/kg/day; right 2 images); and mean (+ SEM) ΔFosB immunoreactivity in the PVN, CeA, and BLA in each group (Panel C). * = Significant difference between sertraline- and vehicle-treated group.

