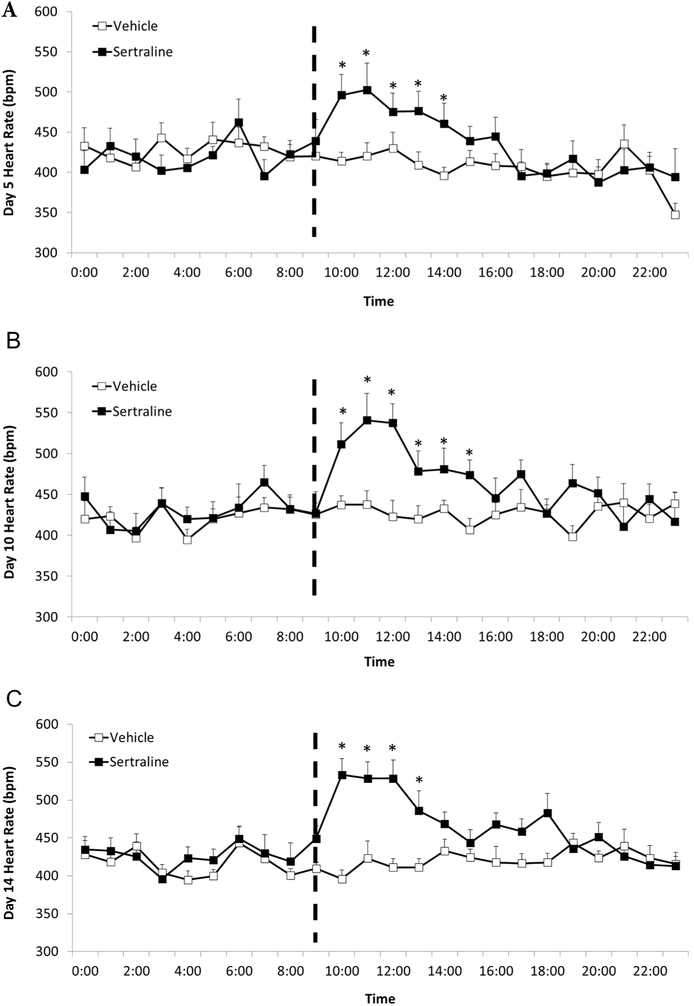
Figure 5.
Mean (+ SEM) hourly HR of male prairie voles on days 5 (Panel A), 10 (Panel B), and 14 (Panel C) of the drug injection period in order to explore the unexpected observation of increased long-term HR in sertraline-treated animals. The data points represent multiple segments of ECG data collected at hourly intervals for 24 consecutive hours on each day. All ECG segments were manually inspected for accuracy of R-wave detection. Manual corrections were made for incorrect or missed detection of R-waves; and data with artifact due to animal movement or poor signal-to-noise ratio were excluded. The dashed line indicates injection time of either sertraline (16 mg/kg/day) or vehicle. * = Significant difference between sertraline- and vehicle-treated group at the same time point.

