Figure 5.
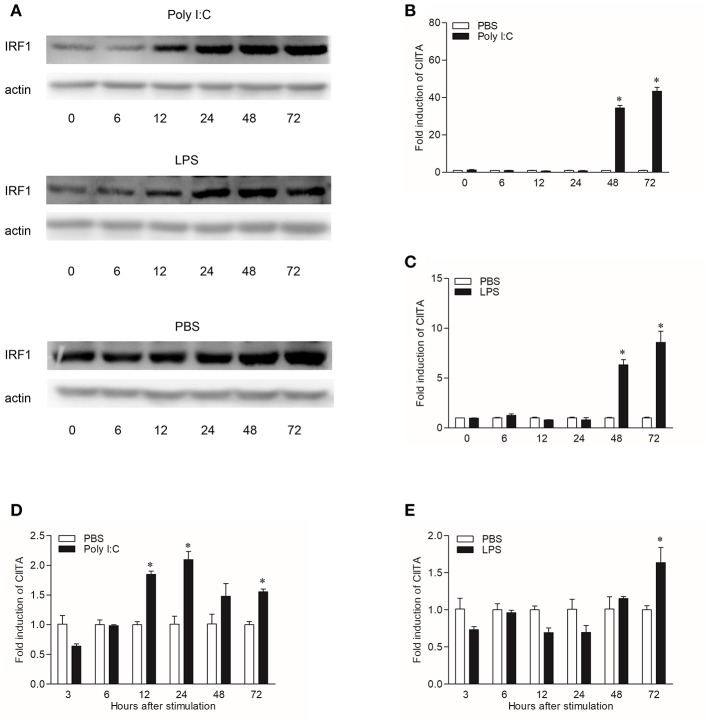
Induction of IRF1 and CIITA by Poly I:C and LPS. (A) Grass carp IRF1 expression in CIK cells stimulated with Poly I:C or LPS. Cell samples were harvested at different time points after stimulation and the gene expression were measured through Western blot. (B,C) Grass carp CIITA expression in CIK cells stimulated with Poly I:C or LPS. Cells were harvested at different time points after stimulation and fold changes of gene expression were measured through qRT-PCR. The expression level was first normalized to that of β-actin and then a stimulated group divided by that of the time-matched controls. (D,E) Grass carp CIITA expression in HKLs stimulated with Poly I:C or LPS. Freshly prepared HKLs were treated with PBS as control or stimulated with Poly I:C or LPS. The mean ± SEM of three fish is shown. Asterisks (*) indicate significant differences from control (p < 0.05).

