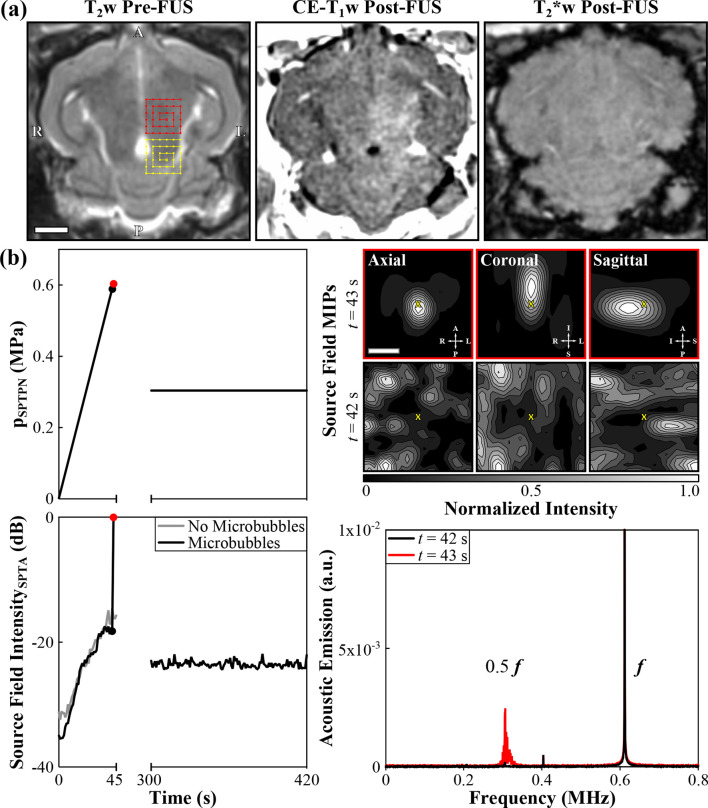
Figure 2.
Example of 3D transcranial subharmonic microbubble imaging for calibrating acoustic exposure levels for inducing volumetric FUS-mediated BBB permeabilization in the thalamus of a New Zealand White rabbit (male, 3 kg) without causing apparent tissue damage. The data correspond to an animal from the “treatment group” of the study described in Ref.74 (a) MRI data. (Left) Axial T 2w MR image acquired pre-FUS. Two non-overlapping target volumes (6 × 6 point grids, 1.0 mm point spacing, “X” symbol denotes calibration point) and their respective electronic beam steering trajectories are illustrated. (Center) Axial CE-T 1w MR image acquired immediately post-FUS. Regions of CE-T 1w MRI signal hyperintensity were induced by the exposures, indicating increased BBB permeability within the target volumes. (Right) Axial T 2*w MR image acquired 15 min post-FUS. No obvious regions of T 2*w MRI signal hypointensity were induced by the exposures. Histological examination of hematoxylin-eosin stained tissue sections revealed no RBC extravasations in this animal,74 confirming that safe exposure levels were employed. Scale bar indicates 5 mm. (b) Ultrasound data corresponding to the posterior-most target volume (yellow). (Top Left) Estimated in situ spatial-peak temporal-peak negative pressure (p SPTPN) and (Bottom Left) SPTA source field intensity of 3D acoustic reconstructions during a calibration sonication with microbubbles in circulation and subsequent therapeutic exposure at the 50% target level (f = 612 kHz, burst length = 10 ms, burst repetition frequency = 1 Hz). Baseline values from a pressure ramp at the same target location acquired without microbubbles in circulation are also shown. The received signals were captured using the array elements tuned to the subharmonic (f/2 = 306 kHz). A delay of 5 min between sonications allowed the bubbles to mostly clear from the circulation. (Top Right) Normalized MIP contour images (linear contours at 10% intervals) of temporal-average source field intensity volume distributions for the bursts 42 s (pSPTPN = 0.59 MPa, no subharmonic activity) and 43 s (pSPTPN = 0.60 MPa, subharmonic activity) into the calibration sonication. The imaging field-of-view is centered on the calibration point (“X” symbols). Scale bar indicates 3 mm. (Bottom Right) Frequency spectrum of the beamformed signal at the location of SPTA source field intensity for the bursts 42 and 43 s into the calibration sonication. The data are normalized to the spectral peak at the fundamental frequency for t = 43 s. Further details regarding the MRI and ultrasound protocols can be found in Ref.74

