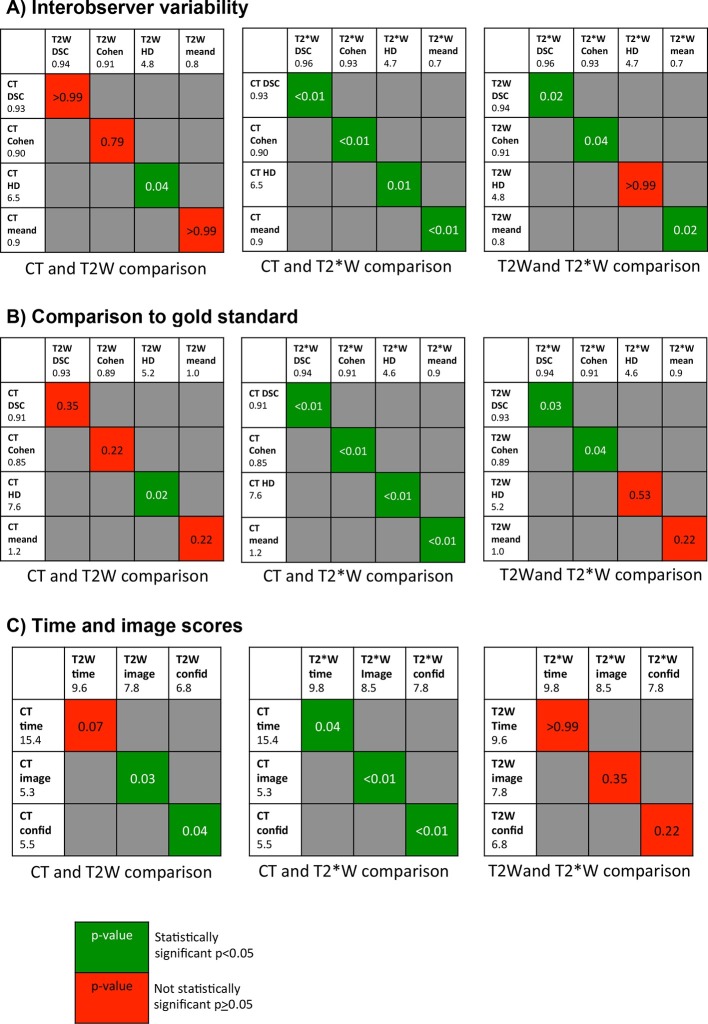
Figure 2. .
Summary of p-values (reported to two decimal places) from statistical testing for comparison between imaging modalities. Values are adjusted for multiple comparisons and statistically significant if p<0.05. Abbreviations: Cohen,Cohen’s κ; mean d, mean distance between contours; confid, confidence in contouring score; image, image quality score; .

