Figure 2.
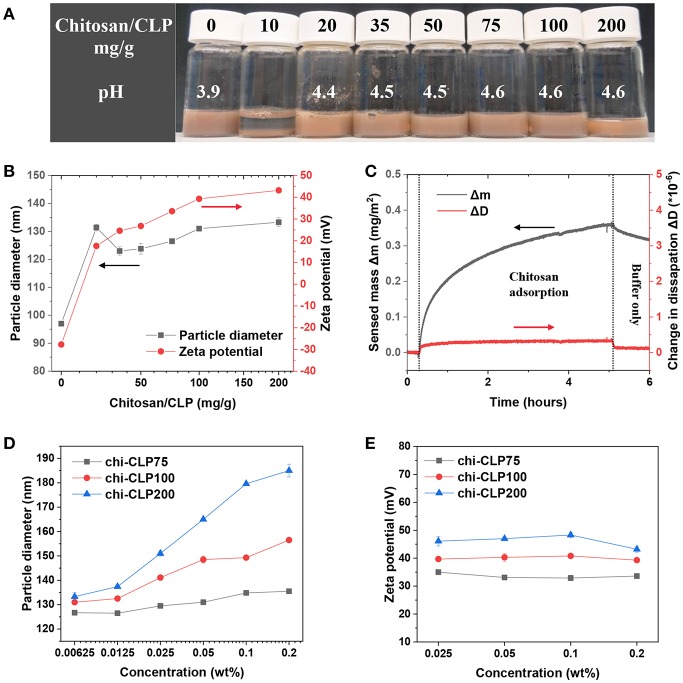
Characterization of coating of CLPs with chitosan. (A) Photograph of the chi-CLP dispersions (0.2 wt%, with chitosan-to-CLP mass ratio varying from 0 to 200 mg/g) after storage for 2 h. (B) Particle diameter and zeta potential of chi-CLPs plotted against the mass ratio of chitosan to CLP. (C) QCM-D analysis of adsorbed mass of chitosan on lignin surface. (D) Particle diameter of chi-CLP75, chi-CLP100, and chi-CLP200 plotted against the chi-CLP concentration, chi-CLP dispersions were diluted with pH 4.5 aqueous acetic acid. (E) Zeta potential of chi-CLP75, chi-CLP100, and chi-CLP200 plotted against chi-CLP concentration, chi-CLP dispersions were diluted with pH 4.5 aqueous acetic acid. The error bars in (B,D,E) denote the standard deviations of three replicates. Note: chi-CLP10 was not measurable by DLS due to strong aggregation and sedimentation.

