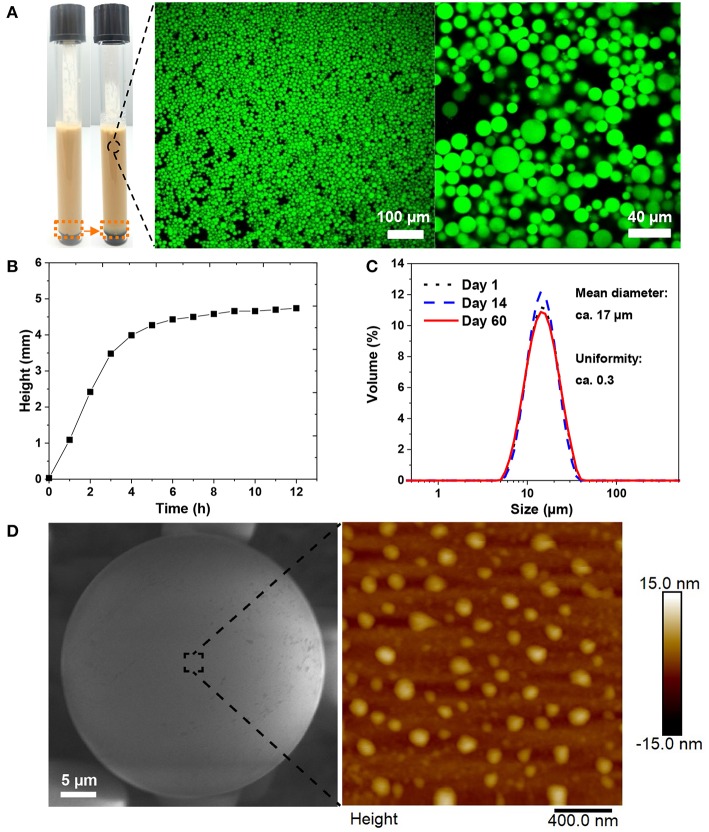
Figure 4.
Stability and surface morphology of the emulsion stabilized by 1 wt% chi-CLP (50 mg/g). (A) Photograph of the emulsion (before and after creaming) and the corresponding confocal microscopic images of the emulsion (oil was stained by Nile red). (B) Creaming behavior of the emulsion, measured with Turbiscan (height was chosen at the backscattered intensity 0.5 (Figure S9) and rescaled by starting from 0, corresponding to the height change marked by orange dash boxes in A). (C) Diameter distributions of the oil droplets on day 1, day 14, and day 60 from emulsion formation. (D) Surface morphology of a single oil droplet covered by STP cross-linked chi-CLPs, imaged with E-SEM (left, oil was solidified at −20°C) and AFM (right, measured at ambient conditions).

