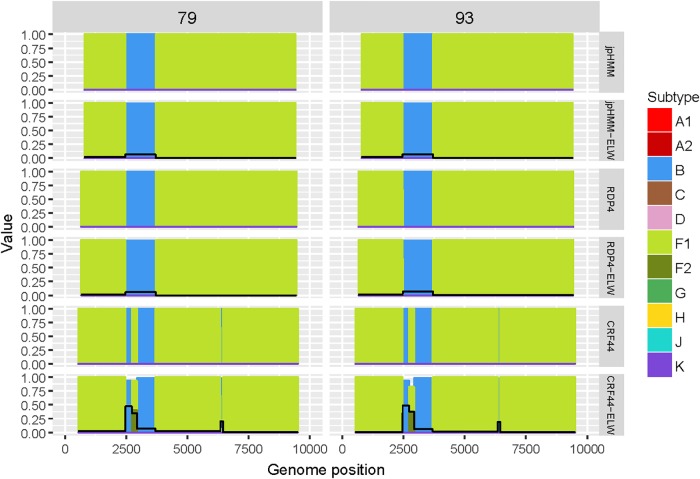
FIGURE 3.
Recombination analyses of samples 79 and 93 with recombination BPs determined by different sources (jpHMM, RDP4 and CRF44_BF reference BPs) and phylogenetic congruence (ELW) tests. The black line represents the proportion of unresolved quartets, which correspond to the inverse of the phylogenetic signal.

