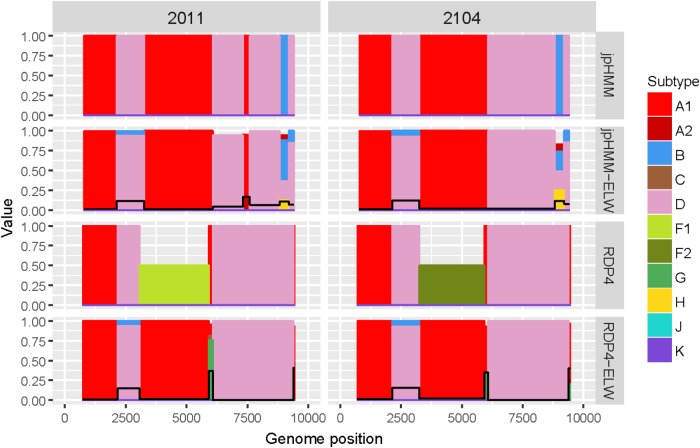
FIGURE 5.
Recombination analyses of samples 2011 and 2104 with recombination BPs determined by different sources (jpHMM and RDP4) and phylogenetic congruence (ELW) tests. Values for inconclusive results by RDP4 are arbitrarily represented as 0.5. The black line represents the proportion of unresolved quartets, which correspond to the inverse of the phylogenetic signal.

