. 2019 Apr 10;10(20):5246–5250. doi: 10.1039/c9sc00663j

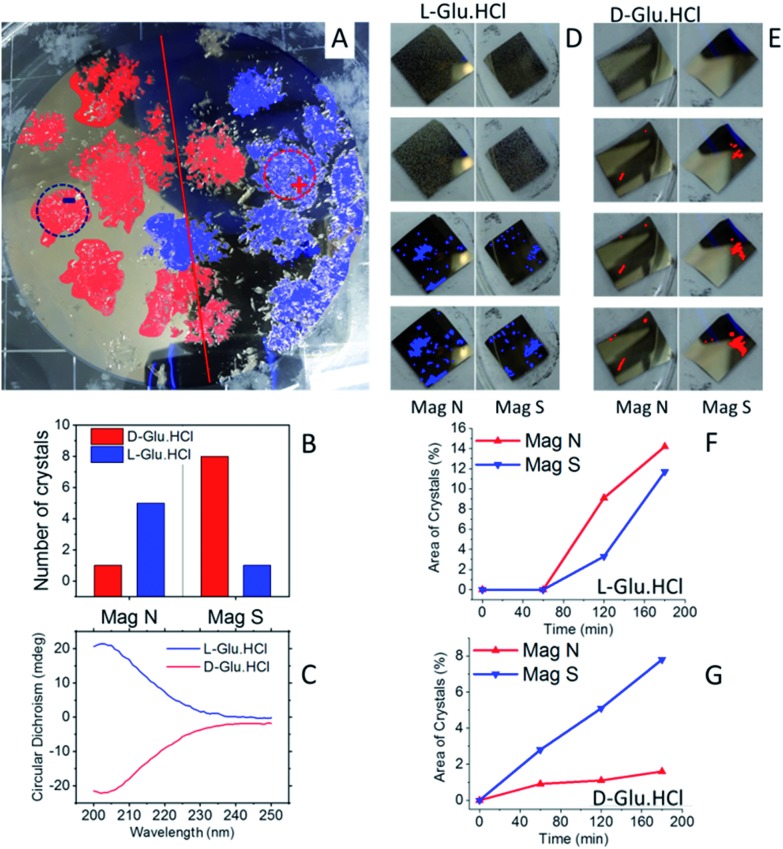
Fig. 4. Enantioselective crystallization of glutamic acid hydrochloride. (A) A racemic solution of Glu·HCl crystallized on a Ni/Au surface (120 nm/10 nm). In red are d-Glu·HCl crystals; in blue are l-Glu·HCl crystals, as measured by CD. The dotted lines denote the area of the magnet located underneath. + and – indicate a magnet aligned N or S, respectively. (B) The amount of l- (blue) and d- (red) Glu·HCl crystals in each half of the wafer. (C) Typical CD spectra of l- (blue) and d- (red) Glu·HCl crystals collected from the substrate. (D) An experiment performed with pure l-Glu·HCl using the experimental configuration, as shown in Fig. 1C. Crystals are formed first on the magnet pointing N. (E) An experiment performed with pure d-Glu·HCl using the experimental configuration as shown in Fig. 1C. Crystals are formed first on the magnets pointing S. The plots (F) and (G) show the growth rate of the crystals on the two magnets, pointing either S or N, for the enantiopure solution of l- or d-Glu·HCl, respectively.

Fig. 4