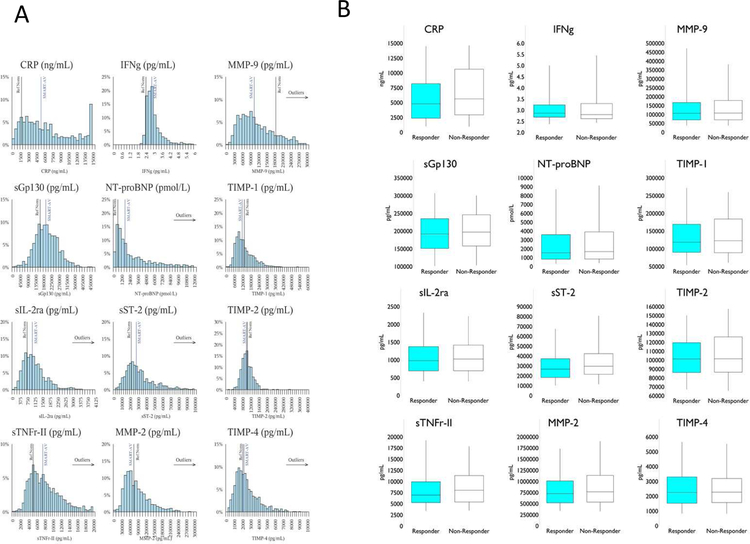
Figure 2.
(A) Histograms for the 12 candidate biomarkers measured in the entire SMART-AV CRT sample set (n=758) with a vertical line representing the mean of the SMART-AV sample. The referent normal values (“Ref Norm”; age-matched control subjects (n=26)) vertical line has been superimposed as a frame of reference. (B) Distribution of the 12 candidate biomarkers as a function of 1st and 3rd quartile and the median value (box and whisker plots), dichotomized for the pre-specified response to CRT. NT-proBNP: 1pmol/L = 0.445 ng/mL

