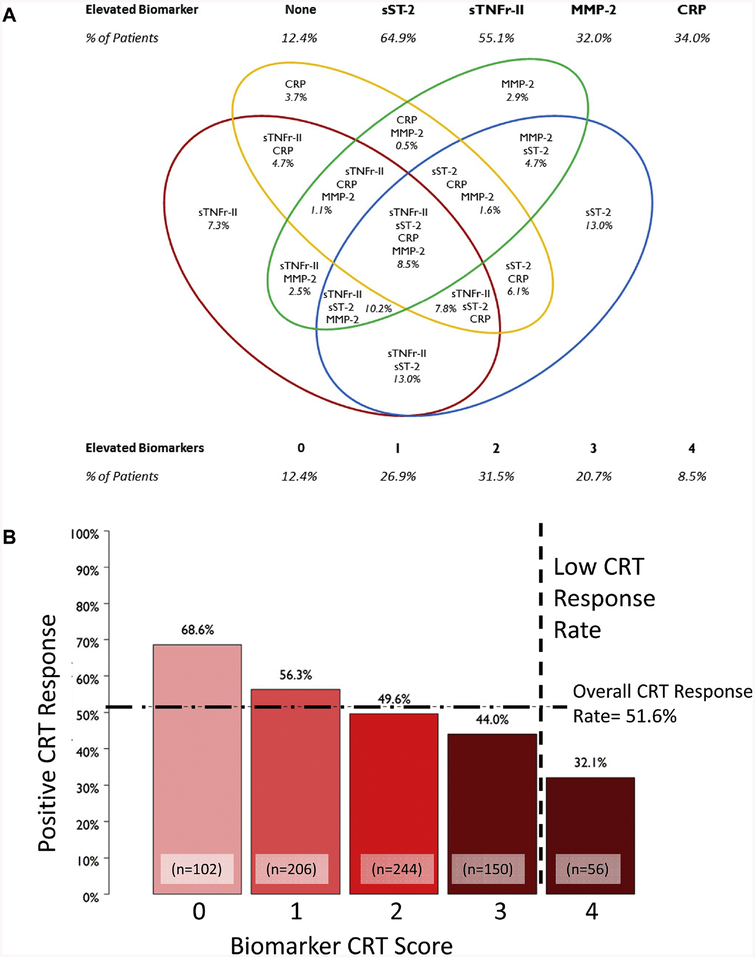
Figure 3.
(A) The final 4 biomarkers selected were used to develop a categorical Biomarker CRT Score. The distribution of the different permutations for elevated biomarker clusters is presented and was used in the composite score algorithm. (B) Distribution of response to CRT as a function of the Biomarker CRT Score, whereby the overall positive response to CRT was ~52%. A Biomarker CRT Score of 0 identified patients with a much higher likelihood of a favorable response to CRT and a score of 4 conferred a poor likelihood of response to CRT (Chi-Square analysis, p<0.001). As shown by the vertical dashed line, the Biomarker CRT Score identified a subset of patients with a very low probability for a response to CRT. The sample sizes for these Biomarker CRT Score quartiles are shown.

