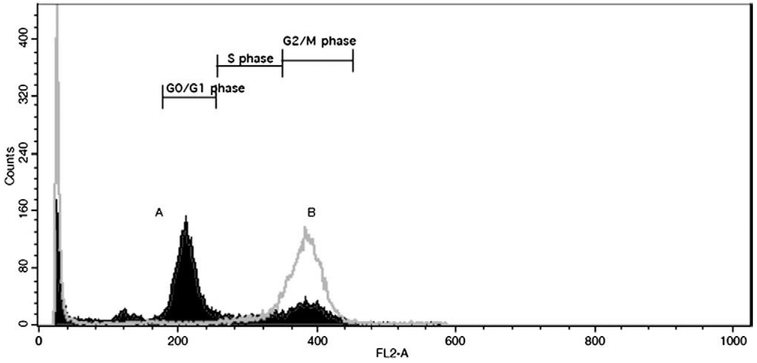
Fig. 2.
Cell cycle analysis: Representative cytogram of gemcitabine-induced effect on human pancreatic adenocarcinoma Capan-2 cells (gray border with no fill, labeled as B) resulting in an increased fraction of cells in G2/M phase as compared to the untreated control cells (black border with fill, labeled as A).

