
Figure 2:
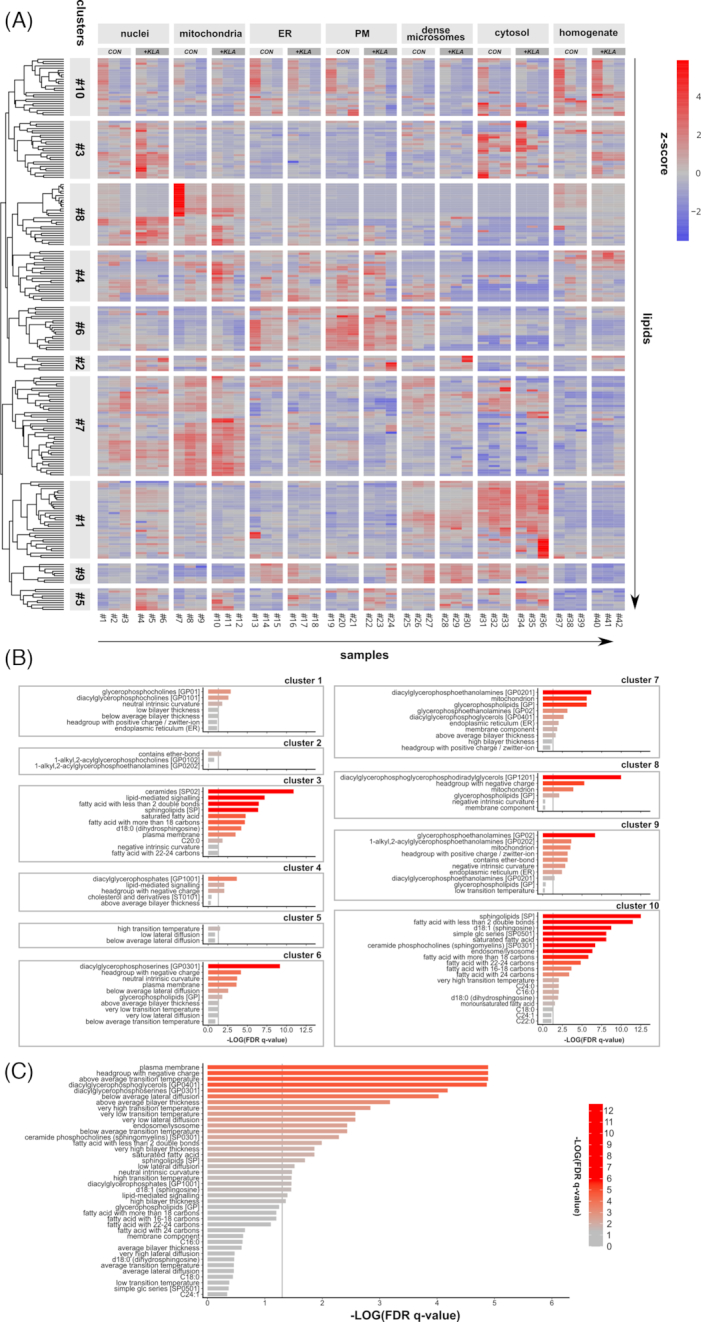
LION-term enrichment analysis of RAW 264.7 macrophages. (A) Heat map of scaled lipid amounts (z-score < 0: blue, z-score > 0: red) of sub-cellular lipidomics data [13] with samples on the x-axis and individual lipid species on the y-axis. Lipids were clustered into 10 groups by hierarchical clustering. (B) Enrichment analyses of all lipid clusters in the “target-list mode". For each cluster, the first n + 2 significant LION-terms are shown. (C) Enrichment analysis of plasma membrane (PM) vs endoplasmic reticulum (ER) fractions in the “ranking mode". The gray vertical lines indicate the cut-off value of significant enrichments (q < 0.05). Bar colors are scaled with the enrichment (−log q-values). FDR: false-discovery rate.