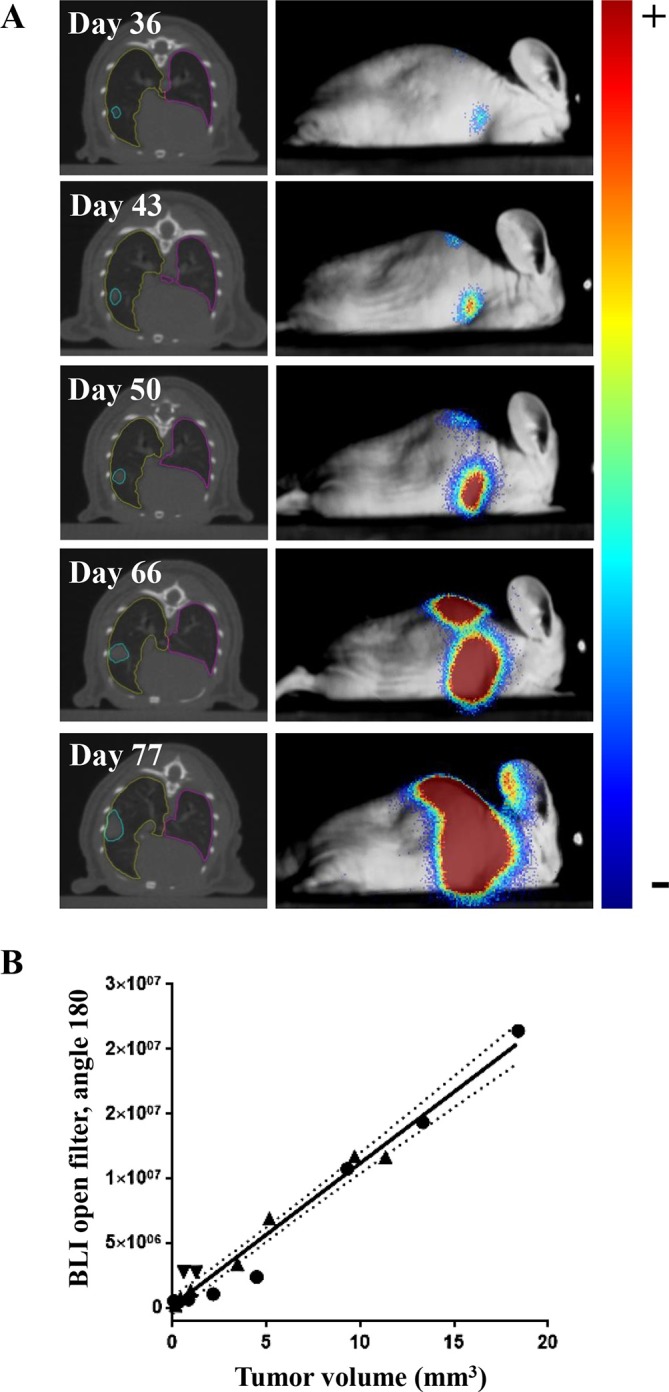
Figure 2.

Correlation between tumor volume determined by CBCT and BLI signal intensity over time. (A) Representative CBCT and 180-angle BLI images (overlaid on the white light image of the mouse) over time. (B) Correlation between CBCT-derived tumor volume (mm3) and BLI intensity obtained from the 180-degree angle for three independent H1299-luciferase expressing tumors. CBCT, cone beam CT; BLI, bioluminescence imaging.
