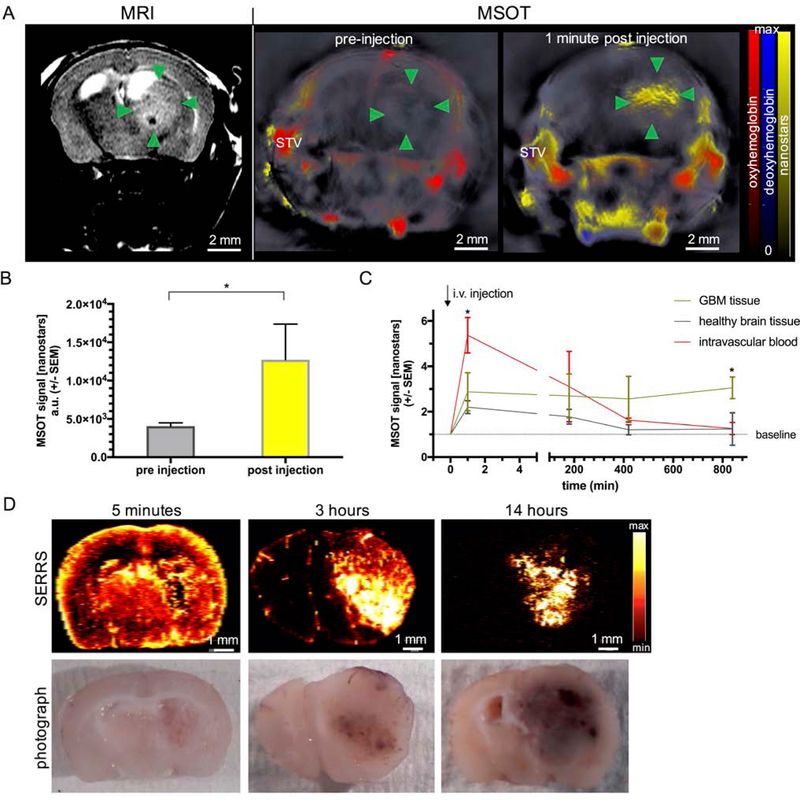
Figure 3. Pharmacokinetic profile of SERRS-MSOT-nanostars in GBM-bearing mice.
A, B, Intravenous administration of the SERRS-MSOT-nanostars in GBM-bearing mice as monitored by T2 weighted MRI led to significantly increased MSOT signal unmixed for the nanostars (yellow) in the tumorous area (green arrowheads) as well as the blood circulation (STV = superficial temporal artery and vein, *P < 0.05, representative example of n = 3). C. The peak signal in the blood stream gradually declined over the course of hours post injection. No remnant signal deriving from the nanostars was detectable by MSOT in the blood or the healthy brain tissue area on the contralateral hemisphere compared to baseline at t=14 h (*P < 0.05). D. The pharmacokinetic profile of the nanostars over the course of 14 hours post intravenous injection is confirmed by ex vivo SERRS Raman imaging.

