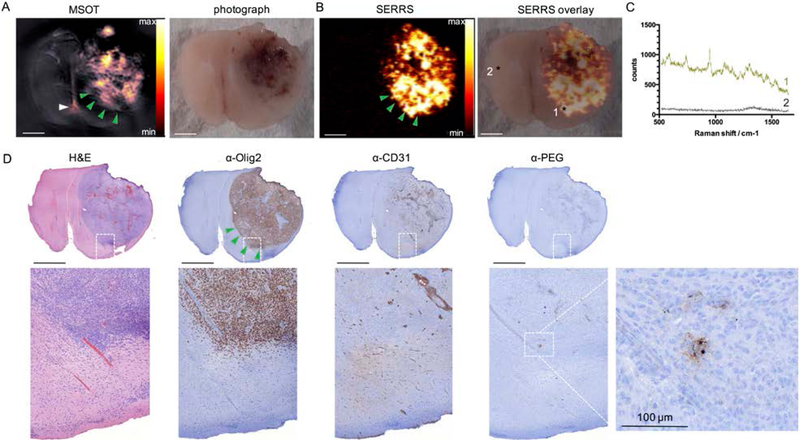
Figure 6. Performance comparison between MSOT and SERRS imaging of SERRS-MSOT-nanoparticles in a GBM tissue section A, B.
Representative example of the excellent dual-modality capabilities of the SERRS-MSOT-nanostars which depict GBM in a mouse model that faithfully recapitulates human GBMs. C. Raman spectrum of tumor (1) and normal brain tissue (2). D. Tissue sections were stained with H&E and IHC staining for Olig-2 (tumor marker), CD31 (neovasulature), and PEG (nanoparticle stain). Scale bars, 2 mm (unless indicated otherwise).

