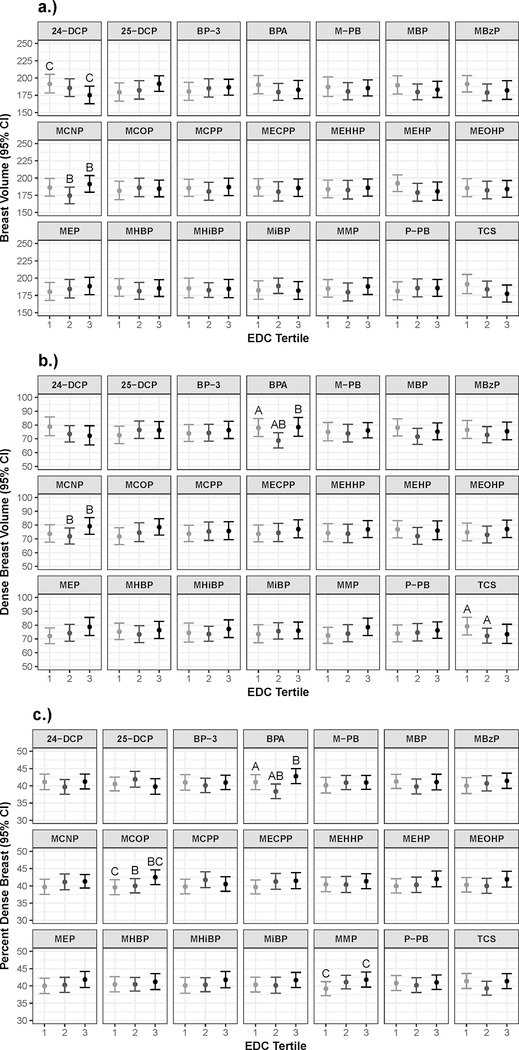
Figure 1.
Changes in breast density associated with urinary phenol and phthalate biomarker concentrations. T1= lowest tertile; T2=middle tertile, T3=highest tertile. Plotting the least-square means and associated 95% CI of a.) breast volume, b.) fibroglandular volume, and c.) %FGV between tertiles of biomarker concentrations based on GEE models adjusting for age at B1 biomarker measurement, age at B4 biomarker measurement, BMI z-score at B1, BMI z-score at B4, and maternal education. Significant difference (p<0.05) between: tertiles T1 and T2 indicated by A, tertiles T2 and T3 indicated by B, and tertiles T1 and T3 indicated by C.

