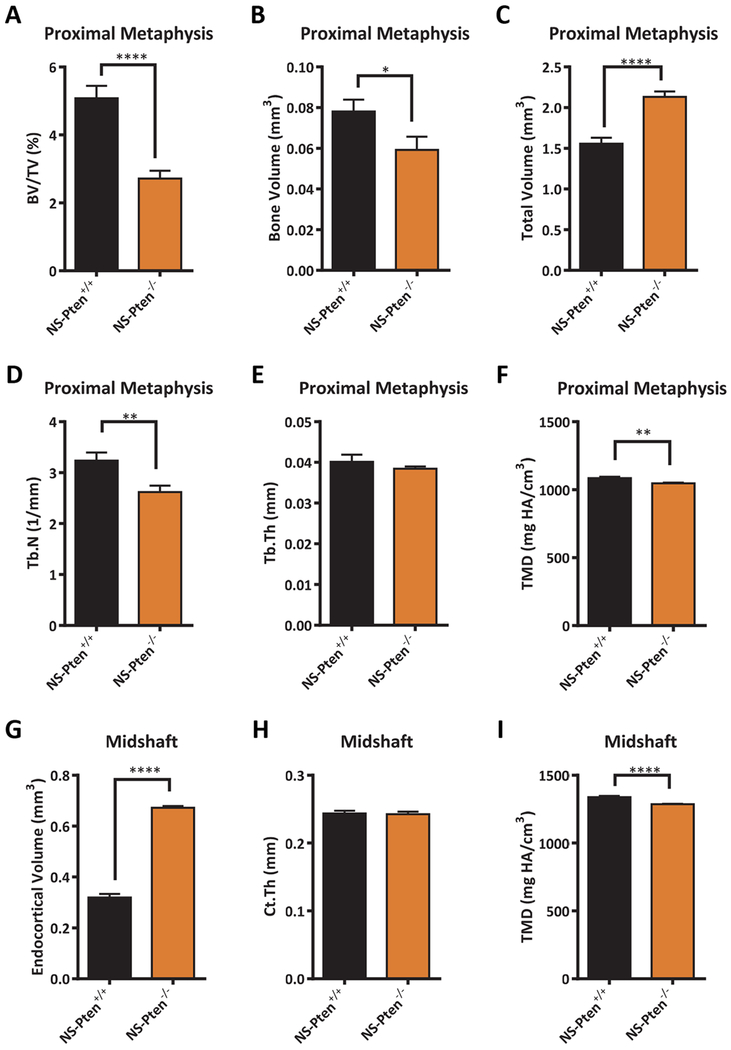
Figure 3.
Analysis of bone mass, morphology, and mineralization in 8 wk NS-Pten−/− mice. Results shown for (A) bone volume/total volume, (B) bone volume, (C) total volume, (D) trabecular number, (E) trabecular thickness, (F) tissue mineral density (metaphysis), (G) endocortical volume, (H) cortical thickness, and (I) tissue mineral density (midshaft). The bars represent the mean and the error bars represent the standard error of the mean. * = p < 0.05; ** = p < 0.01, **** = p < 0.0001. NS-Pten+/+ n= 14; NS-Pten−/− n=12.

