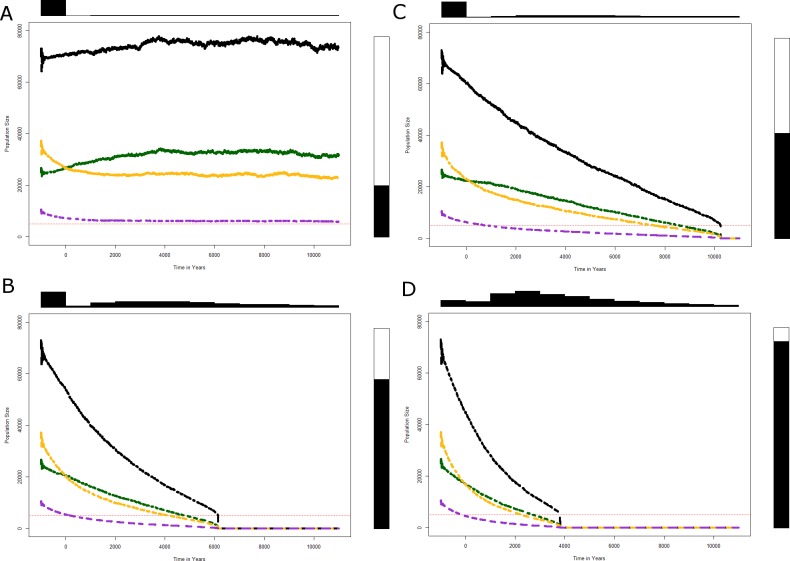
Fig 2. Simulated population trajectories of the Neanderthals over 10,000 yrs.
Lines color correspond to the three subpopulations of Neanderthals in Europe (see Fig 1: subpopulation A in green, B in yellow and C in purple) and in black to total population. Dotted red line shows the MVP (minimum viable population). The top-panel histogram displays the distribution of the time at extinction of the whole Neanderthal population. Right panel gives the proportion of simulated trajectories that hit the threshold population size of 5,000 under which the population was considered as extinct, e.g. the quasi-extinction probability. We present results of median of the 10,000 simulations for scenarios where the overall Neanderthal population never goes extinct (Fig 2A Parameters used in the simulation are shown in Table 1 “Survival”), disappears in 10,000 yrs (Fig 2B Parameters used in the simulation are shown in Table 1 “Demise in 10,000 yrs”), 6,000 yrs (Fig 2C Parameters used in the simulation are shown in Table 1 “Demise in 6,000 yrs”) and 4,000 yrs (Fig 2D Parameters used in the simulation are shown in Table 1 “Demise in 4,000 yrs”).

