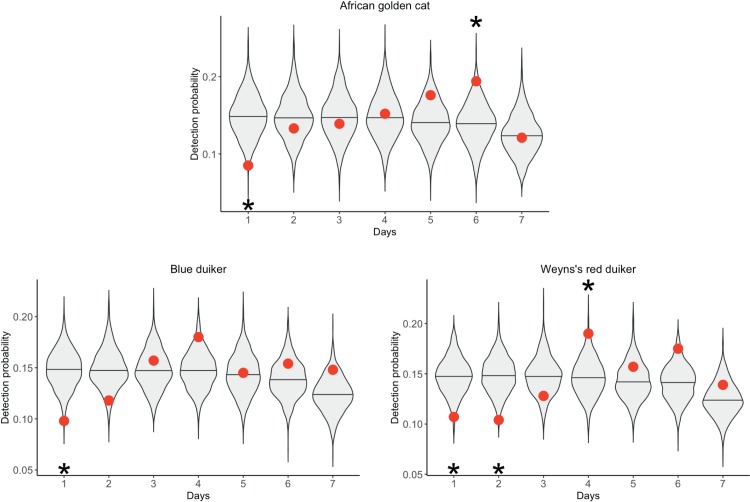
Fig 5. Decreased detection probability following the replacement of attractant during three surveys in Kibale National Park, Uganda in 2013–2014.
Violin plots represent the distribution of random detection probabilities. Observed detection probabilities are indicated with red dots. Significantly high and low detection probabilities are indicated with a star (α = 0.05).

