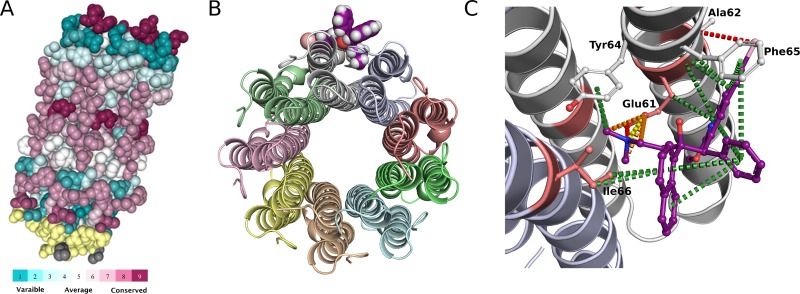
Fig 2. Structure and sequence information.
(A) ConSurf analysis of AtpE (M. tuberculosis) where the evolutionary rates of conservation are color-coded on to the structure. (B) The experimental crystal structure of AtpE bound to Bedaquiline (purple). (C) The key molecular interaction between Bedaquiline (ball and stick representation; purple) and AtpE: ionic bond (yellow), π-interactions (green), proximal hydrogen bond (red) and weak polar van der Waal clashes (orange). The known resistance mutations are shown as salmon red (sticks) on the cartoon representation of the AtpE structure.

