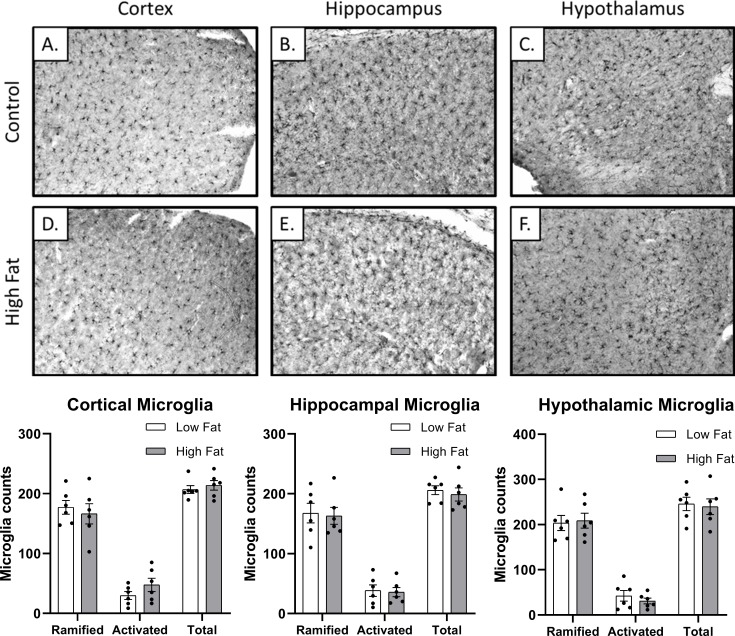
Fig 3. Microglial counts in cortex, hippocampus, and hypothalamus.
Fig A-C reveals representative images for low fat-fed (control) rats. Fig 3D–3F reveals representative images for high fat-fed rats. Activated microglia and ramified (resting) microglia were characterized and counted by a researcher blind to the groups. No significant differences in activated, ramified, or total microglia were found between the two dietary groups.

