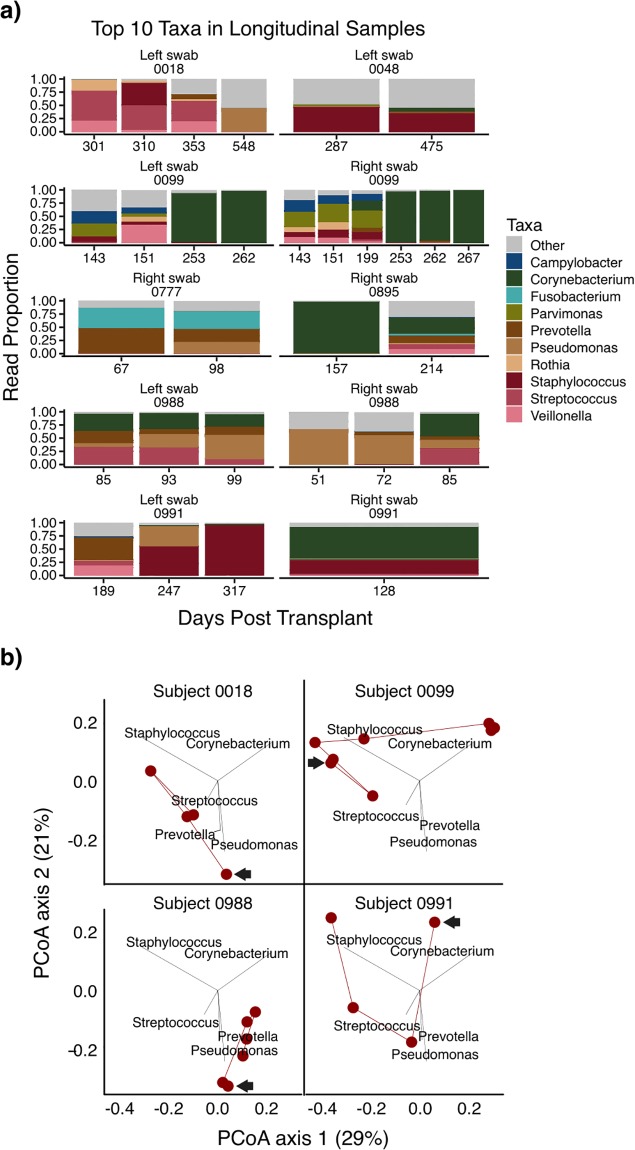
Fig 3. Change in stent biofilm composition over time in subjects with serial stents.
(A) Biofilm communities from subjects with two or more stent samples; if bilateral stents were sampled, the right and left stents are shown separately. Stacked bar graphs represent the proportion of reads assigned the top ten most abundant bacterial genera across samples. The height of a segment of each bar is proportional to its relative abundance and its color reflects the assigned bacterial genus. The number below each sample indicates the number of days since lung transplant that the stent was removed. (B) Stent biofilm communities of four subjects who were sampled at three or more time points are shown on a weighted UniFrac PCoA of the entire sample set. The arrow indicates the first sample and the lines then connect samples sequentially. Three of the four subjects with longitudinal samples had stent biofilms that moved between different clusters over time.

