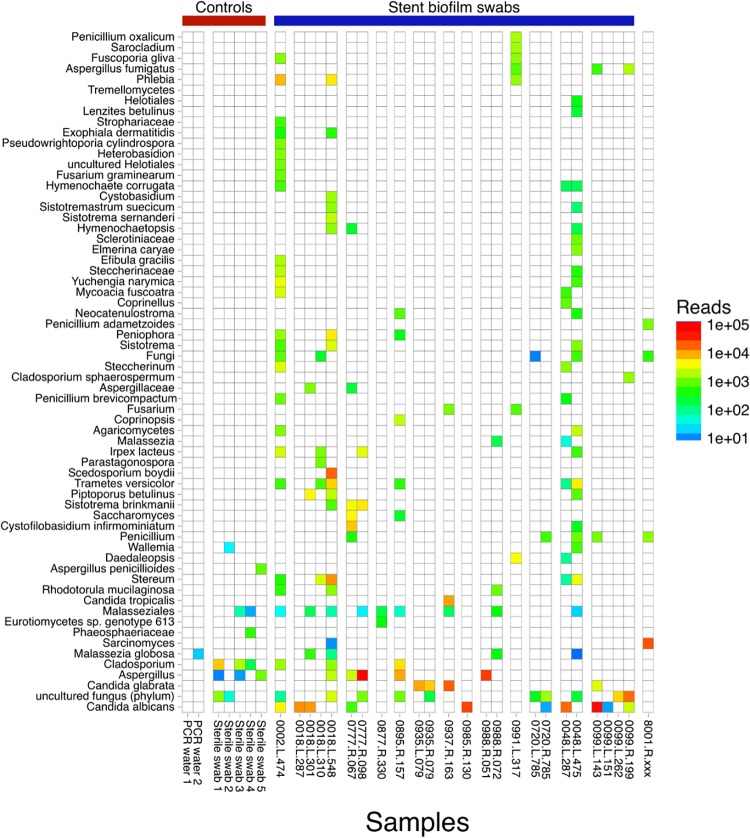
Fig 5. Fungal taxa within stent biofilms samples as determined by ITS sequencing.
Twenty-five biofilm swab samples and seven control samples had fungal ITS amplification sufficient for sequencing. In the heat map, rows reflect fungal taxa at the lowest level assignment possible (down to the species level). Each column is a unique biofilm sample, grouped by subject. The name is in the format of: subject ID—side of stent—day post-transplant. Because the total fungal biomass is highly variable among samples, the color scale reflects absolute read counts rather than relative abundances to avoid exaggeration of taxa in low fungal content specimens. Taxa with fewer than 10 reads in any sample are excluded.

