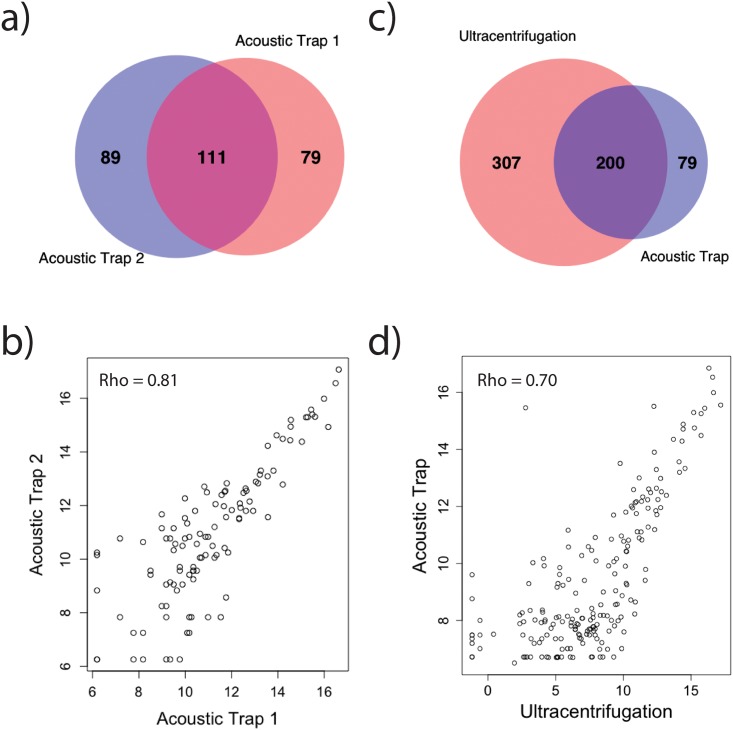
Fig 4. Comparison of the miRNA expression between samples.
a) Venn diagram of common and exclusive miRNA found between the two replicates. Of the total of 279 miRNAs identified by the two replicates, 111 miRNAs are found in both libraries and 168 are exclusive to either of the libraries. b) Spearman correlation of the two replicates shows a significant correlation with rho = 0.81. c) Venn diagram of common and exclusive miRNA found between the acoustic trap and ultracentrifugation samples. Of the total of 586 miRNAs identified, 200 miRNAs are found in both libraries and 307 79 and 307 are found exclusively in the acoustic trap and ultracentrifugation samples respectively. d) Spearman correlation of the normalized miRNA expression of ultracentrifugation and median normalized expression of the acoustic trap replicates shows a significant correlation with rho = 0.70.

