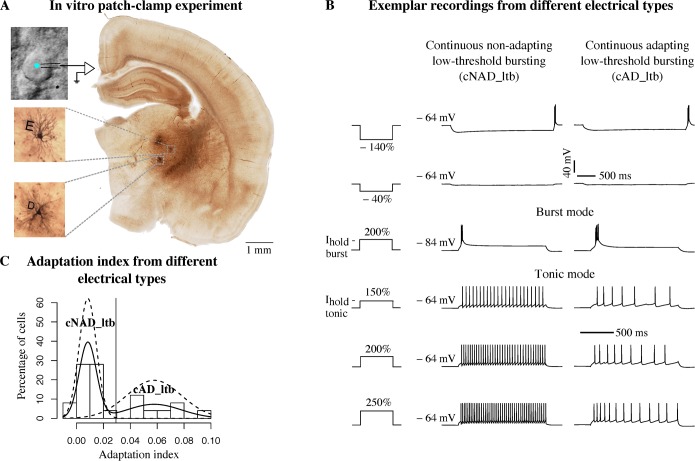
Fig 1. Simultaneous physiological and morphological characterization.
(A) View of a patched cell under optic microscope and anatomical localization of biocytin-filled neurons (insets). Letters D and E identify morphologies in a slice. (B) Voltage responses of two different thalamocortical (TC) neurons to a standardized battery of current stimuli. Each current amplitude was normalized by the threshold current of each neuron (e.g. 150% threshold, see Methods). Third row is a low-threshold burst response from a hyperpolarized holding potential, Vhold = −84 mV (burst mode), the other responses are elicited from a depolarized holding potential, Vhold = −64 mV (tonic mode). Two different holding currents (Ihold—tonic, Ihold—burst) are injected to obtain the desired Vhold. The vertical scale bar applies to all the traces, the first horizontal scale bar from the top refers to the first two rows, the second applies to the last four rows. (C) Analysis of adaptation index (AI) from recordings in tonic mode. Solid line is a non-parametric estimation of the distribution, dashed lines are two Gaussian distributions fitted to the data (see Methods). The vertical line indicates the cut-off value.

