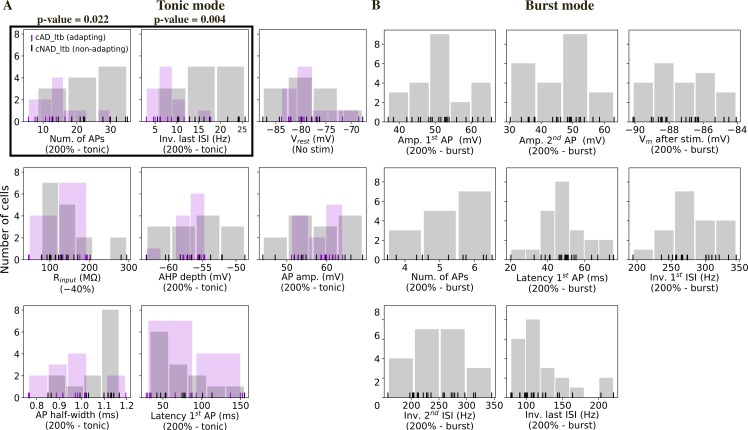
Fig 3. Histograms of electrical features.
Each vertical line represents the mean feature value for a cell. Tonic and burst refer to the holding voltage as in Fig 1. (A) Feature values extracted from recordings in tonic mode (N = 11 cAD_ltb cells, N = 16 cNAD_ltb cells). The features highlighted by a black box show different distributions for the cNAD_ltb and cAD_ltb electrical types (e-types) (p-value<0.05, two-sided Mann-Whitney U test with Bonferroni correction for multiple comparisons). Passive properties (Vrest, Rinput) and spike shape features (AHP depth, AP amp., etc.) did not show clear differences between the two e-types. (B) Features measuring burst firing properties (N = 22 cells).

