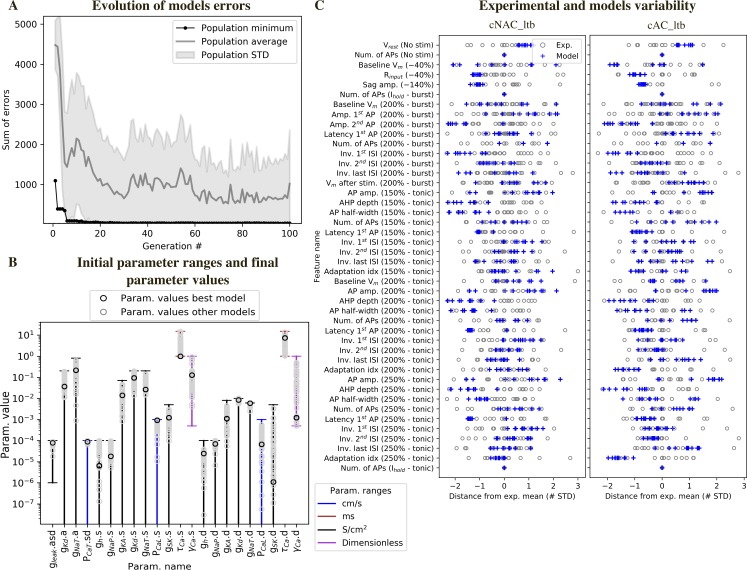
Fig 5. Diversity of model parameters and experimental variability.
(A) Example of model fitting errors (sum of all feature errors) during optimization. (B) Initial parameter ranges and diversity of solutions. Each vertical line represents the range for the parameters, when the horizontal lower bar is missing the bound is 0. The characters following”.” in the parameter name specifies the morphological compartment for the parameter (”s”: soma,”d”: dendrites,”a”: axon). Black circles: parameter values for one of the models in Fig 4, grey circles: parameter values of the models with all feature errors below 3 STD. (C) Features variability in the models and experiments. Blue crosses: feature errors of a sample of 10 models. Each grey circle is the z-scored feature value of one experimental cell, obtained from the feature values shown in Fig 3. The protocol names are shown in parenthesis and corresponds to the stimuli shown in Figs 1 and 4, tonic and burst refer to the holding current as in Fig 1.

