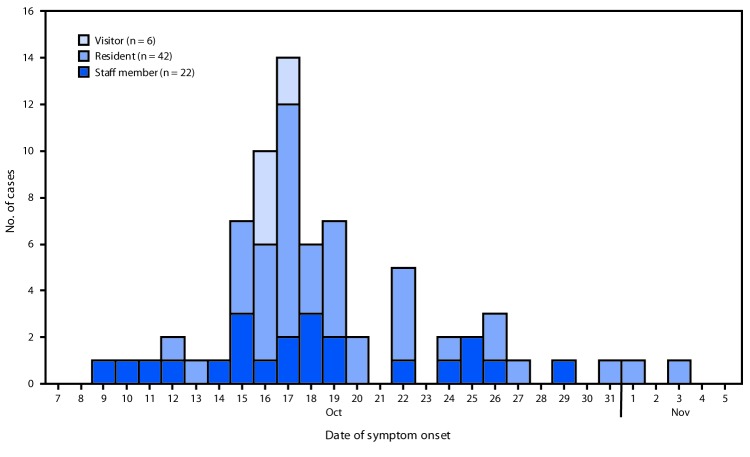
FIGURE.
Confirmed and probable cases of shigellosis at a retirement community outbreak, by date of illness onset and facility affiliation (N = 70*) — Vermont, October–November, 2018
* Five patients (four residents and one staff member) had illness onset within the outbreak period of October 1–November 8 but are not included in figure because exact illness onset date was not known.

