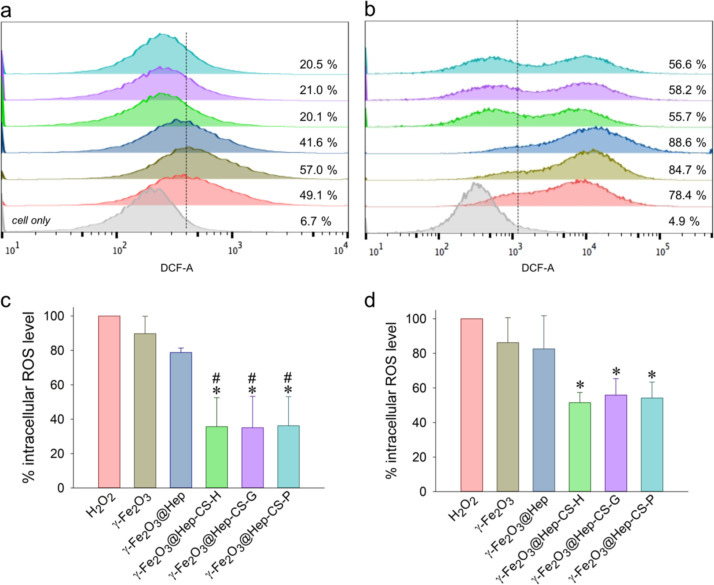
Figure 7.
Flow cytometry analysis of the antioxidant activity of the phenolic compound-modified particles based on intracellular ROS levels in (a, c) L-929 and (b, d) LN-229 cells. (a, b) The representative fluorescence shift was derived from Figure 6. (c, d) Intracellular ROS levels were normalized to the H2O2 levels. *,# p < 0.05 compared to the corresponding results with H2O2 and γ-Fe2O3@Hep, respectively. Values are shown as the mean ± SE (n = 3–4).

