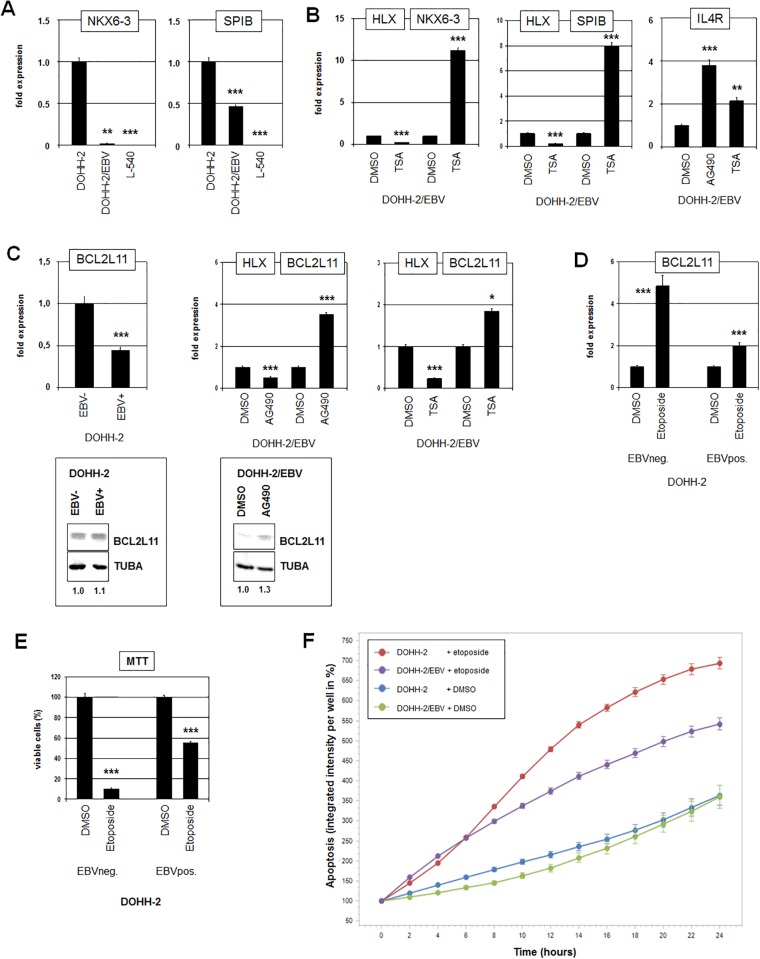
Fig 4. HLX suppresses differentiation and apoptosis.
(A) RQ-PCR analysis of NKX6-3 (left) and SPIB (right) performed in EBV-negative and EBV-positive DOHH-2 cells in addition to L-540 cells. (B) RQ-PCR analysis of EBV-positive DOHH-2 cells treated with TSA for HLX and NKX6-3 (left), for HLX and SPIB (middle), and for IL4R (right). (C) RQ-PCR analysis of EBV-negative and EBV-positive DOHH-2 cells for BCL2L11 (left), and of EBV-positive DOHH-2 cells treated with AG490 (middle) or with TSA (right) for HLX and BCL2L11. Western blot analysis of BCL2L11 (below) was performed in EBV-negative and EBV-positive DOHH-2 cells (left) and in EBV-positive DOHH-2 cells after treatment with AG490 (right). Tubulin alpha (TUBA) served as loading control, densitometric calculations are indicated below. (D) RQ-PCR analysis for BCL2L11 of EBV-negative and EBV-positive DOHH-2 cells treated with etoposide for 16 h. (E) MTT-assay of EBV-negative and EBV-positive DOHH-2 cells treated with etoposide for 16 h shows significantly higher levels of viable cells in EBV-positive DOHH-2 cells. (F) Live-cell imaging analysis of EBV-negative and EBV-positive DOHH-2 cells treated with etoposide for 24 h. Apoptotic cells were quantified using the Caspase-3/7 Green Apoptosis Assay.

