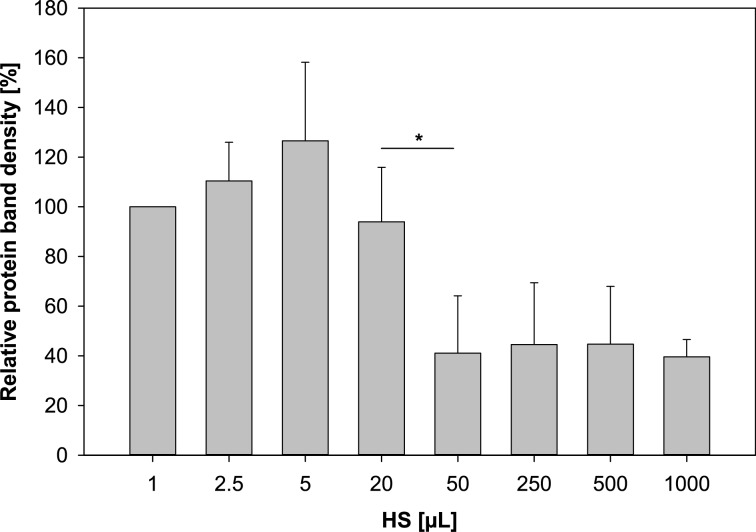
Figure 5.
Semiquantitative densitometry analysis of the eight highlighted protein bands from Figure 3B (mean ± SD; n = 3). The first lane has been selected as standard and the density of the other bands is given relative to this selected band. Abbreviations: human serum (HS).

