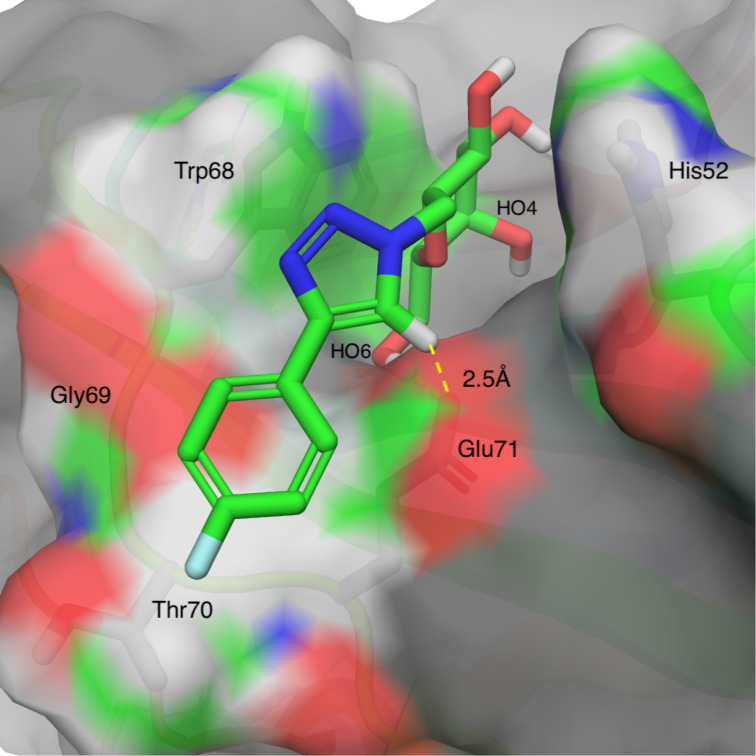
Figure 1.
Galectin-1 in complex with 1b derived by energy-minimizing a representative snapshot from a 200 ns molecular dynamic simulation. The distance between the triazole hydrogen and the Glu71 carboxylate is depicted with a yellow dashed line. The image was generated using PyMOL v1.7 (Schrodinger LLC).

