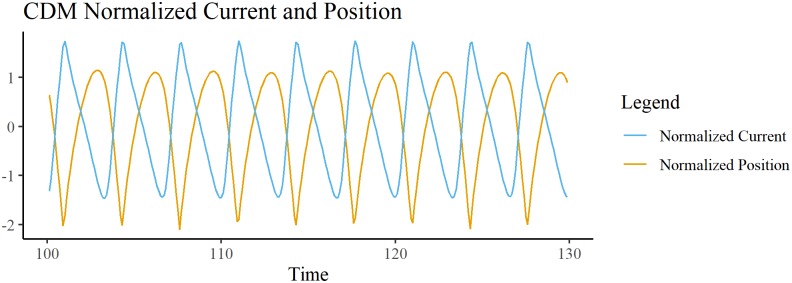
Fig 6. CDM bead position and current.
Time-series for the position of the bead and the current over the simulation. Both time-series are normalized as in Fig 3. The orange curve is the bead’s distance from the source, with minimum distance being the minimum of the curve (not the zero crossing). The peaks of current are out of phase with the peaks of bead displacement, as in the E-SOFI.

