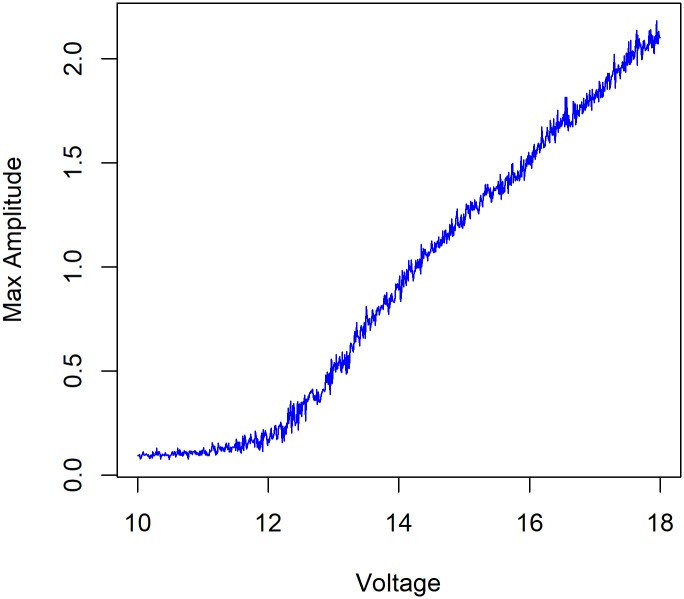
Fig 13. Empirical bifurcation curve.
The maximum amplitude of the oscillations varies as a function of the applied voltage. Here we see that the steady-state is stable for voltage values below 12, and there are finite amplitude oscillations above this critical value, whose amplitude depends on the distance above the threshold.

