
FIGURE 3.
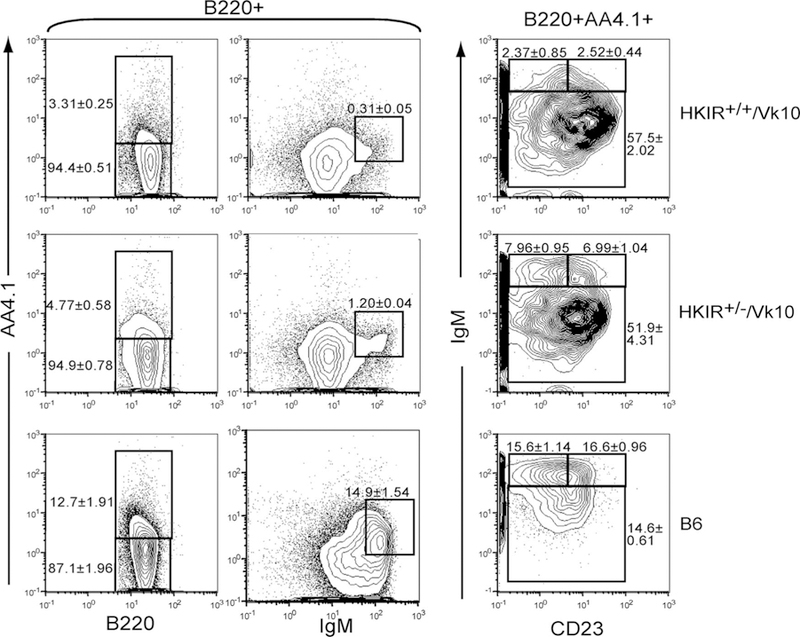
Reduction of T1 and T2 transitional B cells in HKIR+/+/Vκ10 mice. Splenic B cells from mice of the indicated genotypes were stained with Abs specific for the indicated markers and analyzed by four- color flow cytometry. The percentage of cells in each fraction are indicated next to the gates. The data are representative of at least three mice per experiment and multiple experiments.