
Fig. 3. CM-specific inactivation thyroid hormone receptor enhances CM proliferation in neonatal mice.
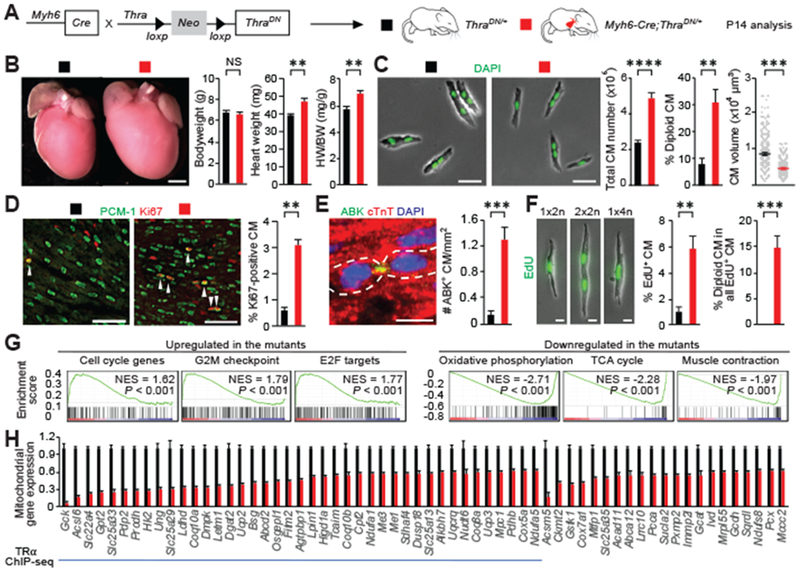
(A) Schematic for generating Myh6-Cre;ThraDN/+ mice with CM-restricted expression of a dominant negative (DN) TRα and analyzing phenotypes at P14. (B) Measurement of the bodyweight (BW) and heart weight (HW) (n = 4 mice). (C) Ventricular CM number, ploidy, and size analysis (n = 3 to 7 mice). (D to F) CM proliferative activity analysis. Representative images and quantifications of (D) proliferating CMs that stained positive for Ki67, (E) Aurora B kinase (ABK) localization at the cleavage furrow, and (F) EdU (n = 4 animals). Arrowheads indicate proliferating CM. In (E), cardiomyocytes undergoing cytokinesis are outlined. In (F), EdU was analyzed in dissociated CMs at P14 from mice injected with EdU at P12 and P13. 1×2n, 2×2n, and 1×4n denote CMs with one diploid nucleus, two diploid nuclei, and one tetraploid nucleus, respectively. (G) Expression profiling. Gene set enrichment analysis of up-regulated and down-regulated pathways in the mutant heart based on the RNA-seq analysis. (H) RNA-seq and ChIP-seq analysis. Mitochondrial genes whose expression is significantly down-regulated in the mutant hearts are shown (n = 3 hearts). The blue line marks mitochondrial genes directly targeted by TRα. Values are reported as mean ± SEM. NS, not significant. **P < 0.01, ***P < 0.001, ****P < 0.0001. Scale bars, (B) 1 mm; (C) 50 μm; (D) 100 μm; (E) and (F) 20 μm.