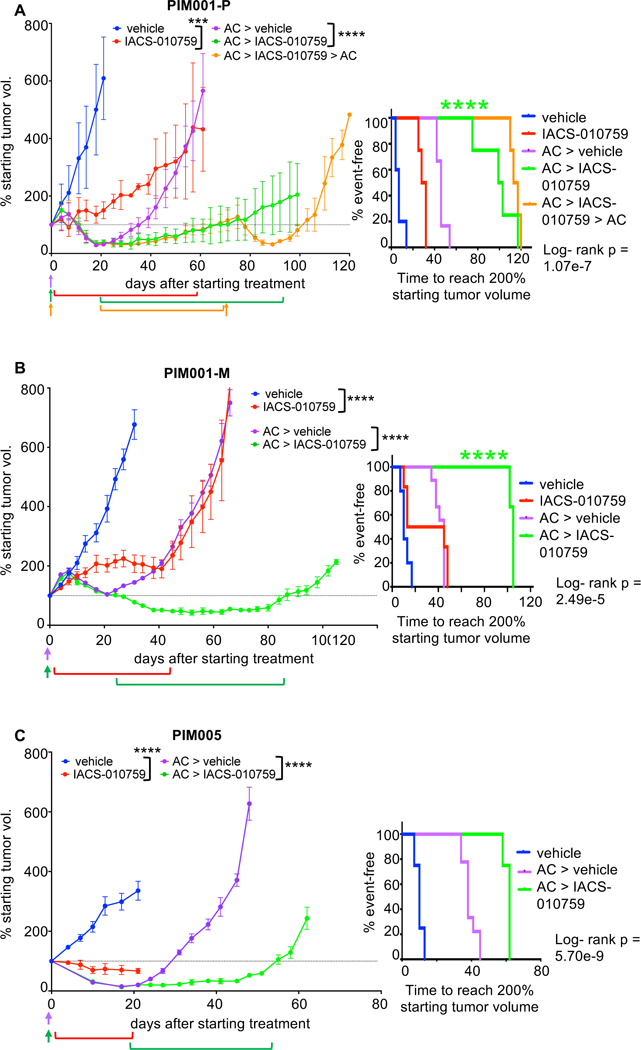
Figure 7. The residual tumor state is targetable by inhibition of oxidative phosphorylation.

A. NOD/SCID mice bearing PIM001-P tumors were treated with an inhibitor of oxidative phosphorylation (IACS-010759, per os [p.o.], quaque die [q.d.]) or vehicle in the treatment-naïve or in the residual setting after AC treatment (> in the figure indicates sequential treatments). Days of IACS-010759 treatment are indicated by brackets. Days of AC treatment are indicated by arrows. ***ANOVA p-value <0.001 (day 21), ****ANOVA p-value <0.0001 (day 61). Data shown are mean +/− SEM (n=4–6 per group). The right panel is a Km curve of the time for each mouse’s tumor to reach 200% of the starting tumor volume (measured on day 0), and the log-rank p-value is shown. Testing for interaction of treatment effects using a hazards model (data file S9) shows synergy in the AC + IACS-010759 sequential combination (****p<0.0001).
B. As above, mice bearing PIM001-M tumors were treated with the indicated agents. ****ANOVA p-value <0.0001 (day 31 & day 66). Data shown are mean +/− SEM (n=3–9 per group). Testing for interaction of treatment effects using a hazards model (data file S9) shows synergy in the AC + IACS-010759 sequential combination (****p<0.0001).
C. As above, mice bearing PIM005 tumors were treated with the indicated agents. ****ANOVA p-value <0.0001 (day 21 & day 48). Data shown are mean +/− SEM (n=4–8 per group).
