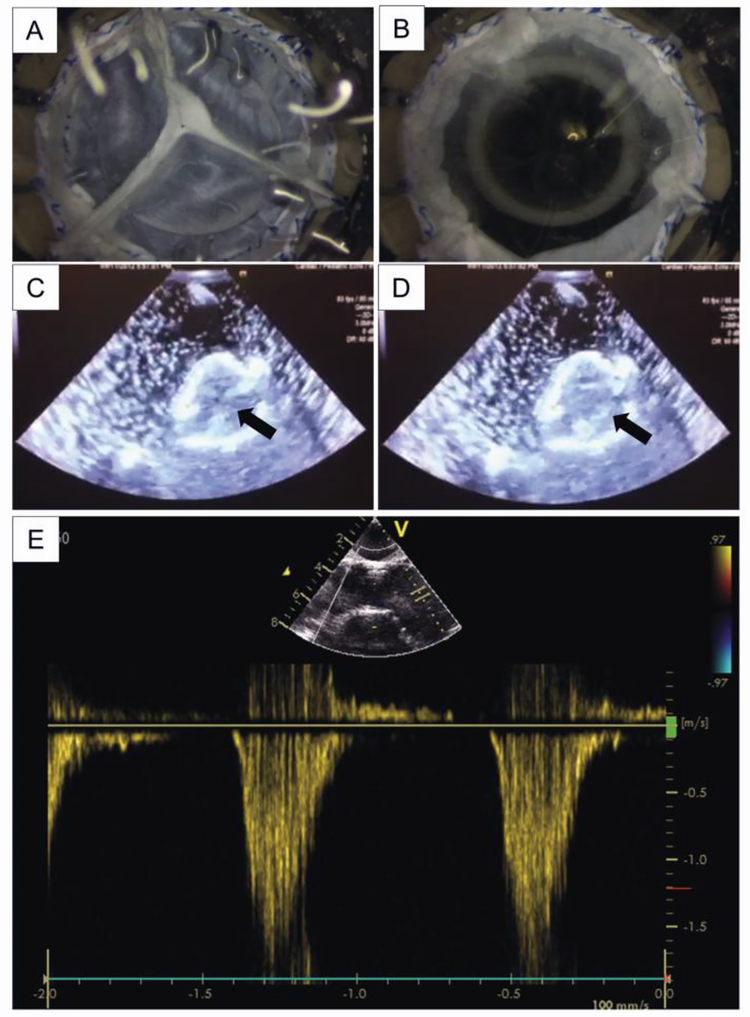
Figure 7. Imaging of a tissue valve in bioreactor.
Photographs of the tissue valve shown (A) closed during diastole and (B) open during systole. Visualization of the valve is helpful for monitoring and troubleshooting, but is not required for testing to ISO 5840 specifications. Echocardiographic images of the valve shown (C) closed during diastole and (D) open during systole. The arrows in (C) and (D) are pointing to the same cusp to indicate its movement. (E) Doppler recordings of flow through the valve orifice are useful for real time assessment of regurgitation and stenosis.

