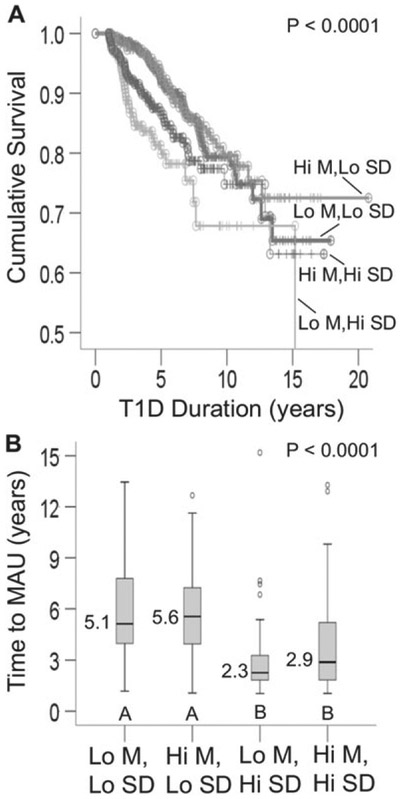
Fig. 2.
Comparison among subjects stratified by their mean-A1c and standard deviation (SD)-A1c. Low mean: mean-A1c <50th percentile; high mean: mean-A1c ≥ 50th percentile. Low SD: SD-A1c <50th percentile; High SD: SD-A1c ≥ 50th percentile. (A) Survival curves for microalbuminuria (n = 1195). (B) Box plots showing time to microalbuminuria (MAU) in patients who developed MAU (n = 172). Time to MAU differed between patients with low SD (box plots labeled A) vs. high SD (box plots labeled B); p < 0.002 for all pair-wise comparisons of box plots A vs. box plots B. Open circles represent outliers.

