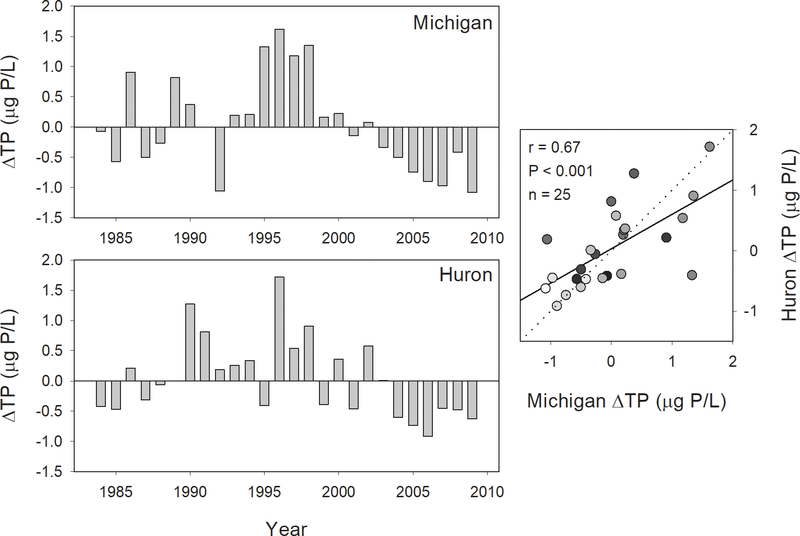
Figure 11.
Residuals of estimated and predicted total phosphorus in Lake Michigan and Lake Huron (left graphs) and correlation between residuals in Lake Michigan (x-axis) and Lake Huron (y-axis), 1983–2009 (right graph). Dotted line indicates 1:1 relationship; solid line indicates least-squares regression line, provided for reference. Gradation of symbol fills correspond to year, with lighter fills indicating more recent years.

