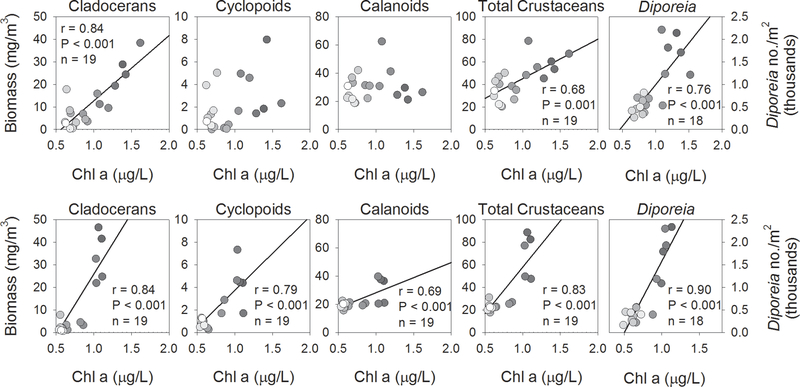
Figure 4.
Correlations between April-July chlorophyll a, estimated by remote sensing, and August zooplankton biomass, by major taxonomic group, and Diporeia from stations > 90 m, for Lake Michigan (top panels) and Lake Huron (bottom panels), 1997–2016. Statistical results are shown where correlations were significant (α = 0.05); solid line indicates least-squares regression line, provided for reference. Gradation of symbol fills correspond to year, with lighter fills indicating more recent years. Correlation results are provided when significant (α = 0.05).

