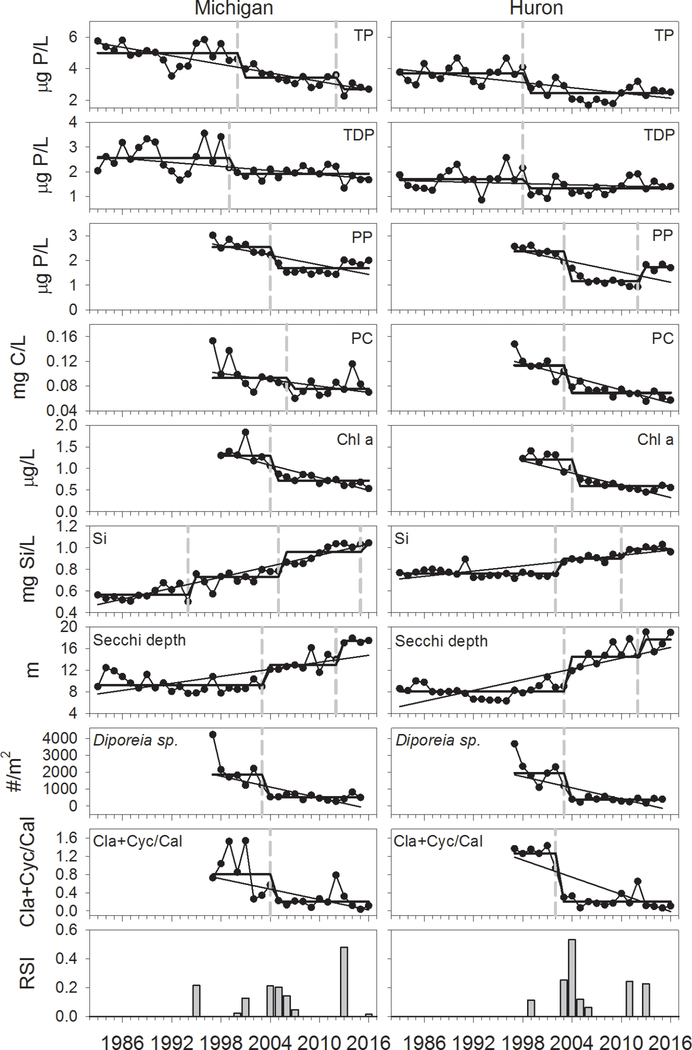
Figure 7.
Regime shift analysis of spring total phosphorus, total dissolved phosphorus, particulate phosphorus, particulate organic carbon, May chlorophyll a, spring soluble silica, spring Secchi depth, August profundal (> 90 m) Diporeia abundance, and ratio of August cladoceran and cyclopoid biomass to calanoid biomass for Lake Michigan and Lake Huron, 1983–2017. Dashed vertical lines indicate occurrences of shifts, straight lines indicate Sen-Thiel regressions, stepped lines indicate averages for each period. Bottom panel indicates regime shift values averaged across all variables.

