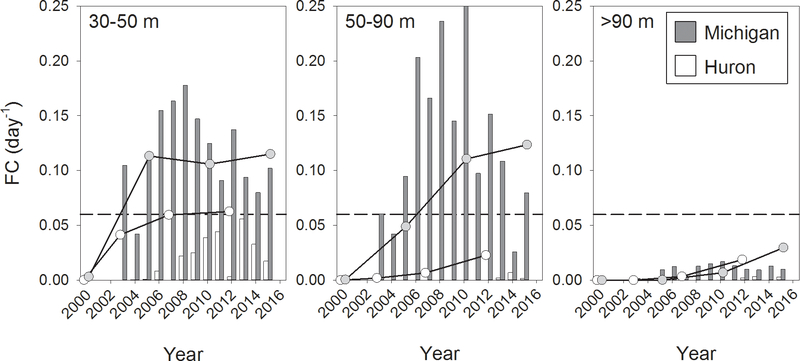
Figure 8.
Estimated fraction of water column cleared (FC) by Dreissena filtration in different depth zones of Lake Michigan and Lake Huron. Bars represent FC calculated from GLNPO data; lines represent FC estimated from more extensive NOAA/CSMI surveys. Dotted line corresponds to nominal average growth phytoplankton rate of 0.06 day−1 (Fahnenstiel et al., 2000). See text for details of calculations.

