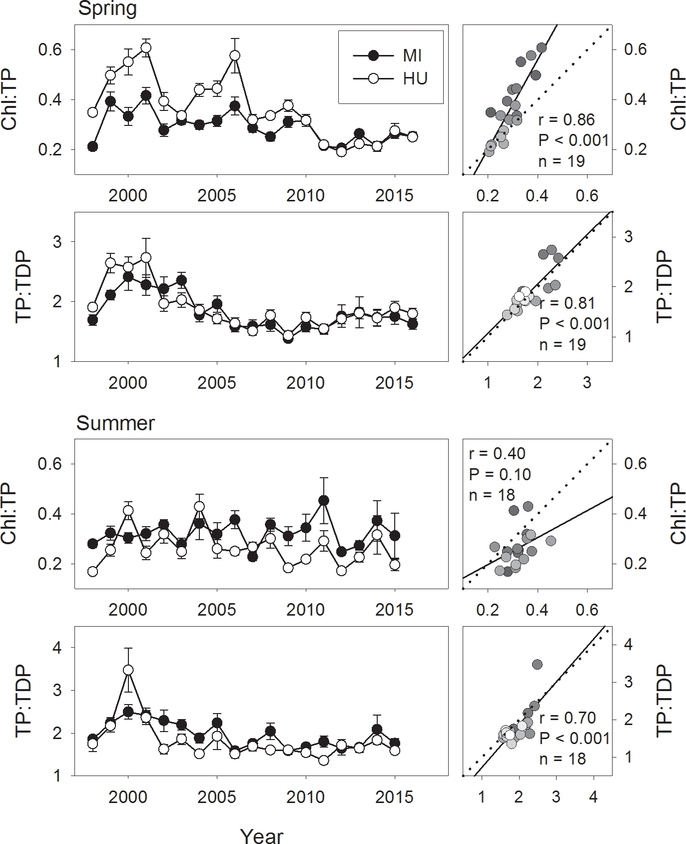
Figure 9.
Spring (April) and summer (August) chlorophyll a:total phosphorus ratios and total phosphorus:total dissolved phosphorus ratios for Lake Michigan and Lake Huron, 1998–2016. Right hand plots show correlations of respective variables between Lake Michigan (x axis) and Lake Huron (y axis). Dotted line indicates 1:1 relationship; solid line indicates least-squares regression line, provided for reference. Gradation of symbol fills correspond to year, with lighter fills indicating more recent years. Correlation results are provided when significant (α = 0.05).

