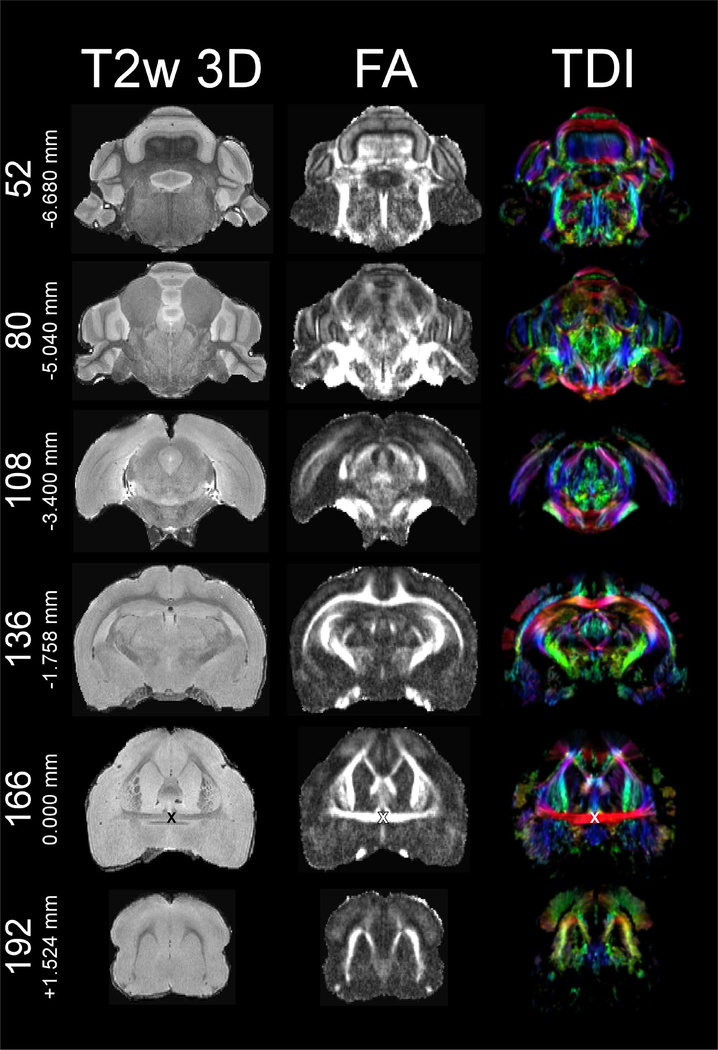
Figure 1.
T2 weighted 3D-RARE (left), fractional anisotropy (middle), and color-coded tract density images (TDI) (right) at coronal planes 52/250 (−6.680 mm), 80/250 (−5.040 mm), 108/250 (−3.400 mm), 136/250 (−1.758 mm), 166/250 (0.000 mm), and 192/250 (+1.524 mm). “X” marks the origin (i.e., anterior-posterior zero point) at anterior commissure (plane 166/250) in all three modalities. Note that the apparent “shadow” in the left hemisphere of slice plane 108 in the T2w 3D-RARE map, which does not appear in the corresponding slice planes of the FA or color-coded TDI maps, is a signal void due to the relative local homogeneity of the magnetic field at the time of T2w 3D-RARE data acquisition. The diffusion-weighted scans (i.e., AD, b0, FA, MD, RD, and TDI) were acquired at a later time, had a better local shim, and thus did not present the same local signal void. Since the T2w 3D-RARE, the various diffusion-weighted scans, and histological sections were used as guides during delineation, our delineations of cortex were in no way complicated by this signal void. However, those using the T2w 3D-RARE map for their studies should be aware of this signal void.

